| Posted by Mike Richards on 18/04/2021 | 0 Comments |

US Stock Indices have seen unprecedented gains since the lows back in March 2020. The moves down into those lows from the highs barely one month earlier in February 2020 were the fastest on record yet just over one year later and against a back drop of a global pandemic the US Markets are seeing consistently higher then higher new all time highs. Put Call Ratio’s, Price Earnings Ratios and a host of other metrics are regularly touted across social media platforms as being at or beyond levels where we “should” see markets reverse yet prices stubbornly refuse to “do the obvious” by moving lower and appear immune to the fears and trepidations of the wounded and howling Bears while the Bulls point to the improving unemployment numbers, retail sales figures and economies re opening coupled with the extraordinary actions of the Federal Reserve.
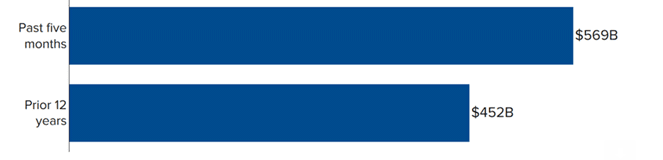
In the past five months since November 2020 inflows into stock funds have totalled $569 Billion. In the prior twelve years total inflows were $452 Billion. Once again the more contrarian view of this statistic would be an argument for the Bears while the more obvious inference the one adopted by the Bulls.

On 25th March this year we learned that a large hedge fund, Archegos was in trouble and being unwound. As this fund traded on swaps Archegos brokers essentially held shares on their behalf thus the failure resulted in several major institutions facing huge potential losses. On the assumption that much of the overall long exposure of these institutions was likely hedged and considering the 5% gain seen in the S&P 500 Index since the beginning of April the Archegos unwinding is likely been/is a contributory factor to an already traditionally seasonally bullish month.
On Friday (16th April 2021) the SPX closed at 4185, up on the session thus making that 15 of the last 16 sessions to close out with net gains. Friday was also the Monthly Options Expiry and the volume of expiring contracts was large and more in line with those expected for a quarterly or “triple witching” expiration.
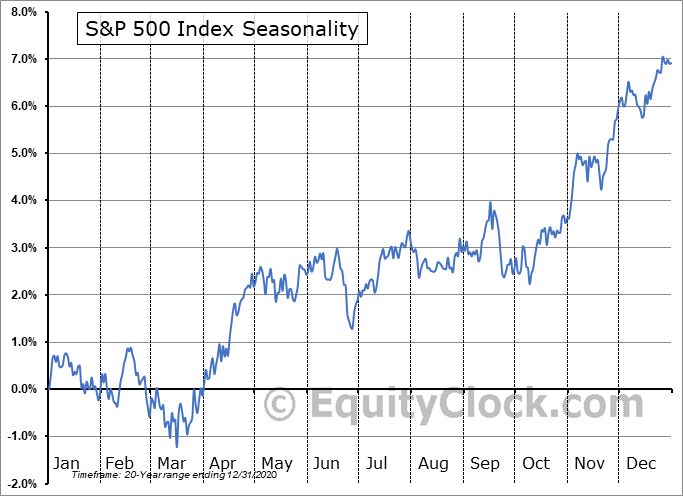
Turning to a more technical approach our Cycles work suggests that we should be expecting a move lower into late June/early July. Looking at our Elliott Wave and fibonacci analysis we are expecting that move lower to materialise but likely after we see further highs although those should be following a small pullback into support in the near term.
This is the most recent analysis posted to members in our Forum relating to the ES Mini.
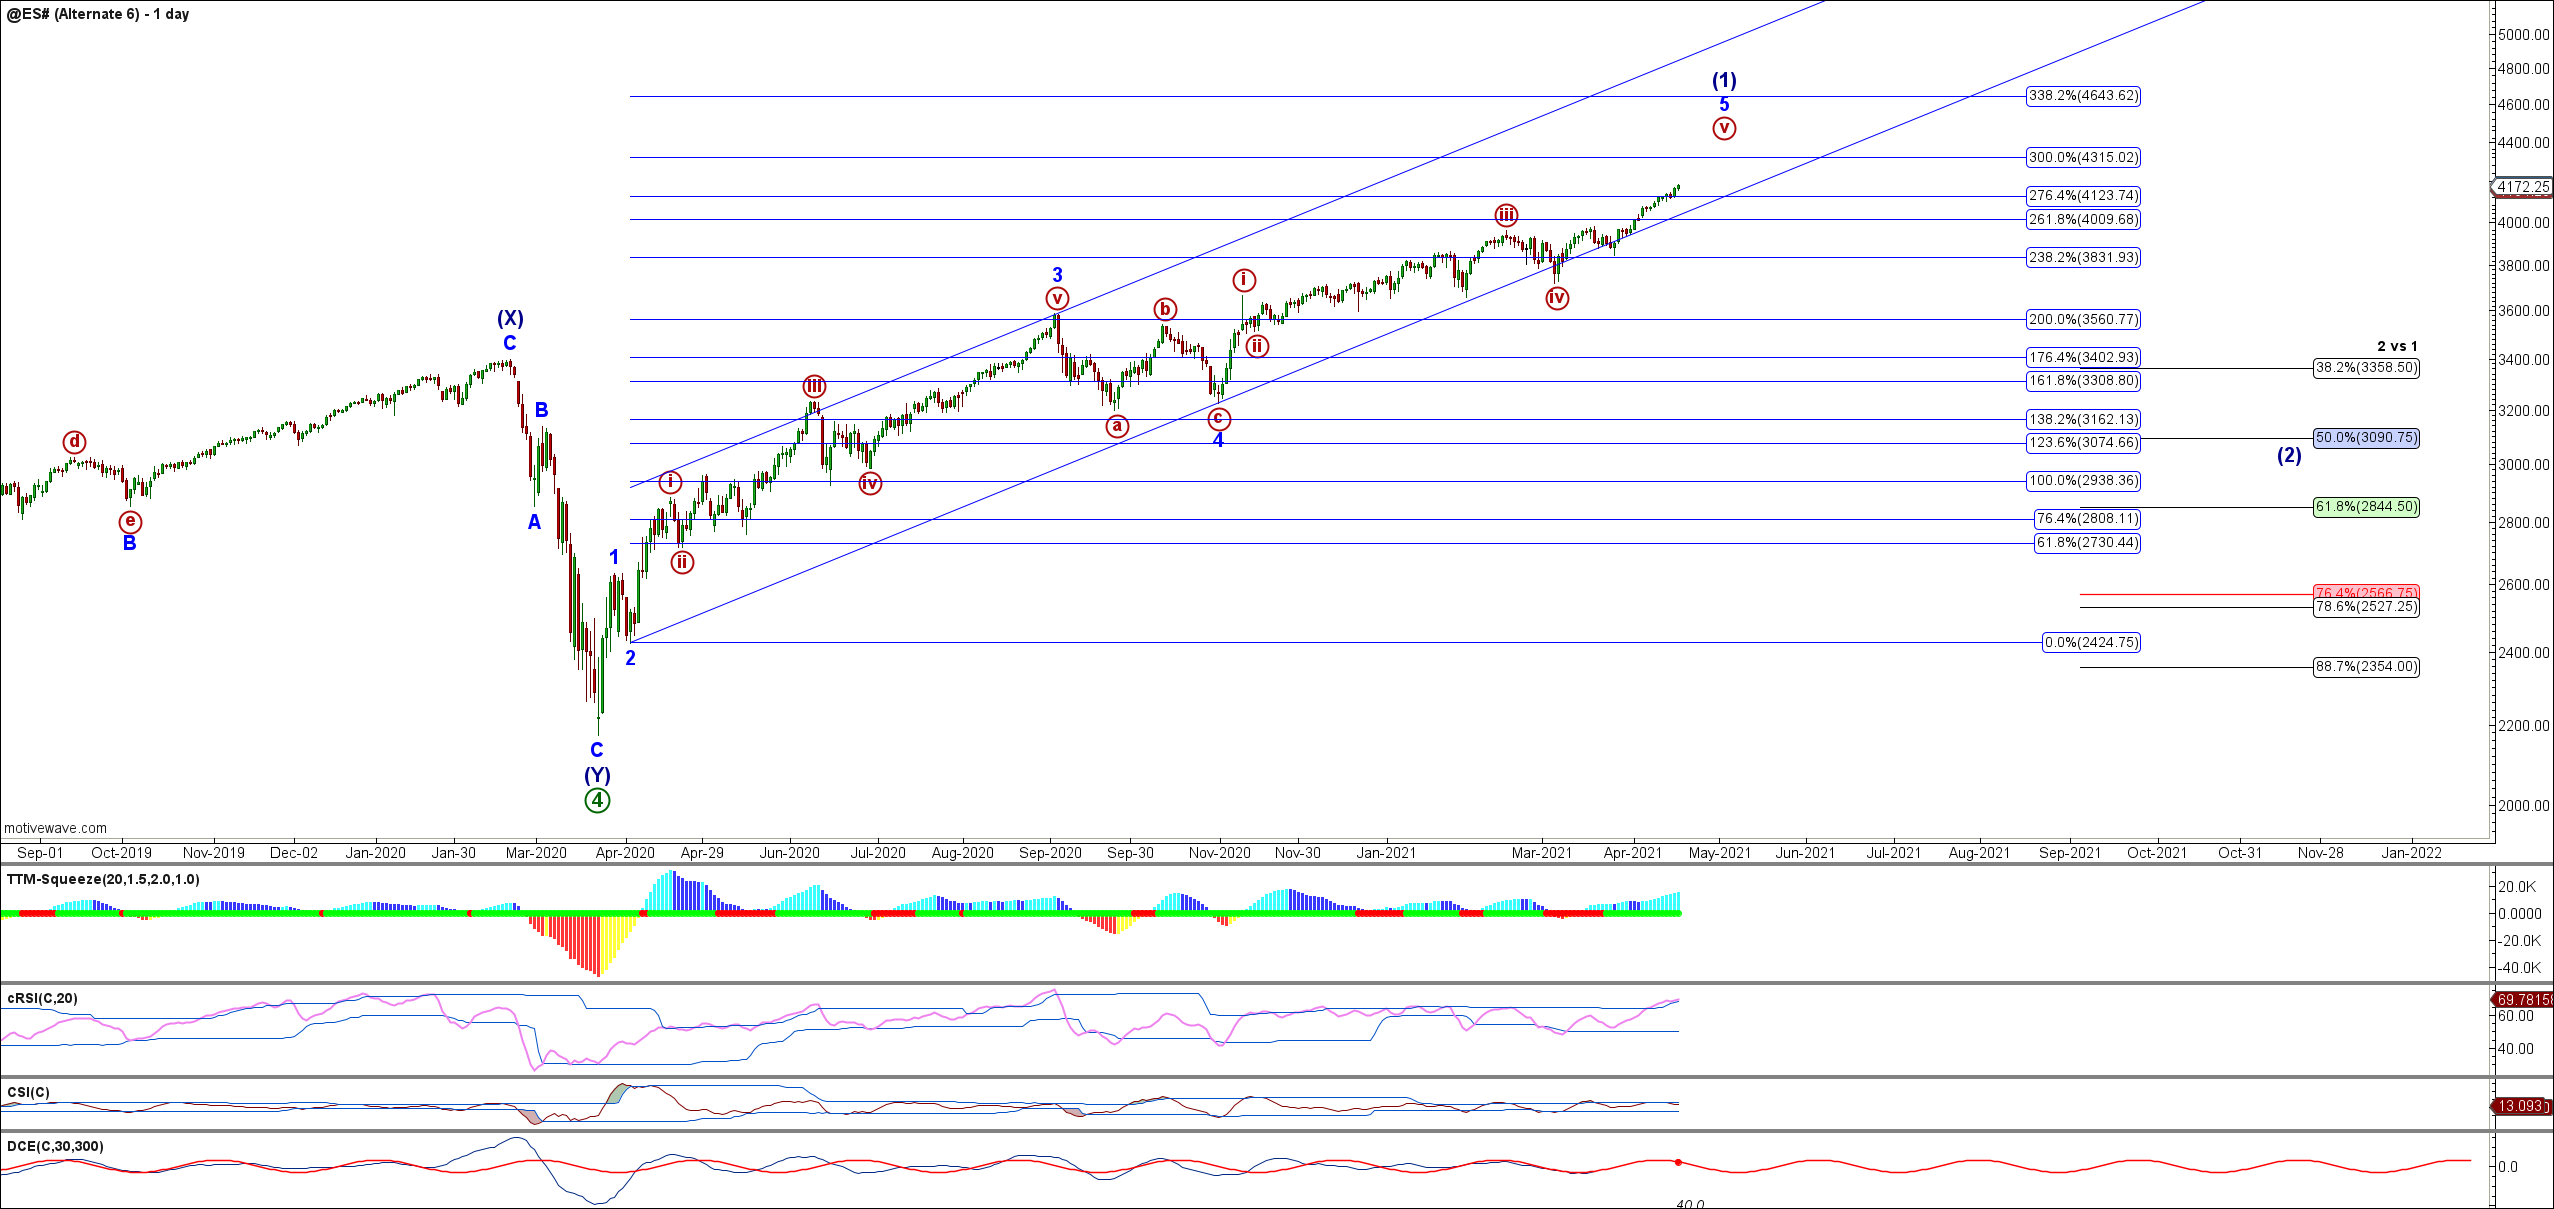
"The ES looks to have completed a complex Primary Degree Wave 4 at the low seen in March 2020. The final drop into that low from the February 2020 high was the fastest recorded drop of this magnitude .
The move up from the March 2020 counts best in threes so a diagonal formation. The ES has exceeded the February 2020 high which has opened up the possibility that this fractal is in fact an ending rather than leading diagonal either as the final Intermediate Degree Wave (5) of the Primary Degree Wave 3 off the March 2009 lows OR in fact as all of the Primary Degree Wave 5 off that low. Again, for the purpose of analysis I am currently running with the thesis that this is a leading diagonal for the Intermediate Degree wave (1) of a much larger Primary Degree Wave 5 off the March 2020 low and that after a pullback in what would then be an Intermediate Degree Wave (2) we will see the US Indices subdivide much higher over the coming few years before a considerably deeper move to the downside is upon us.
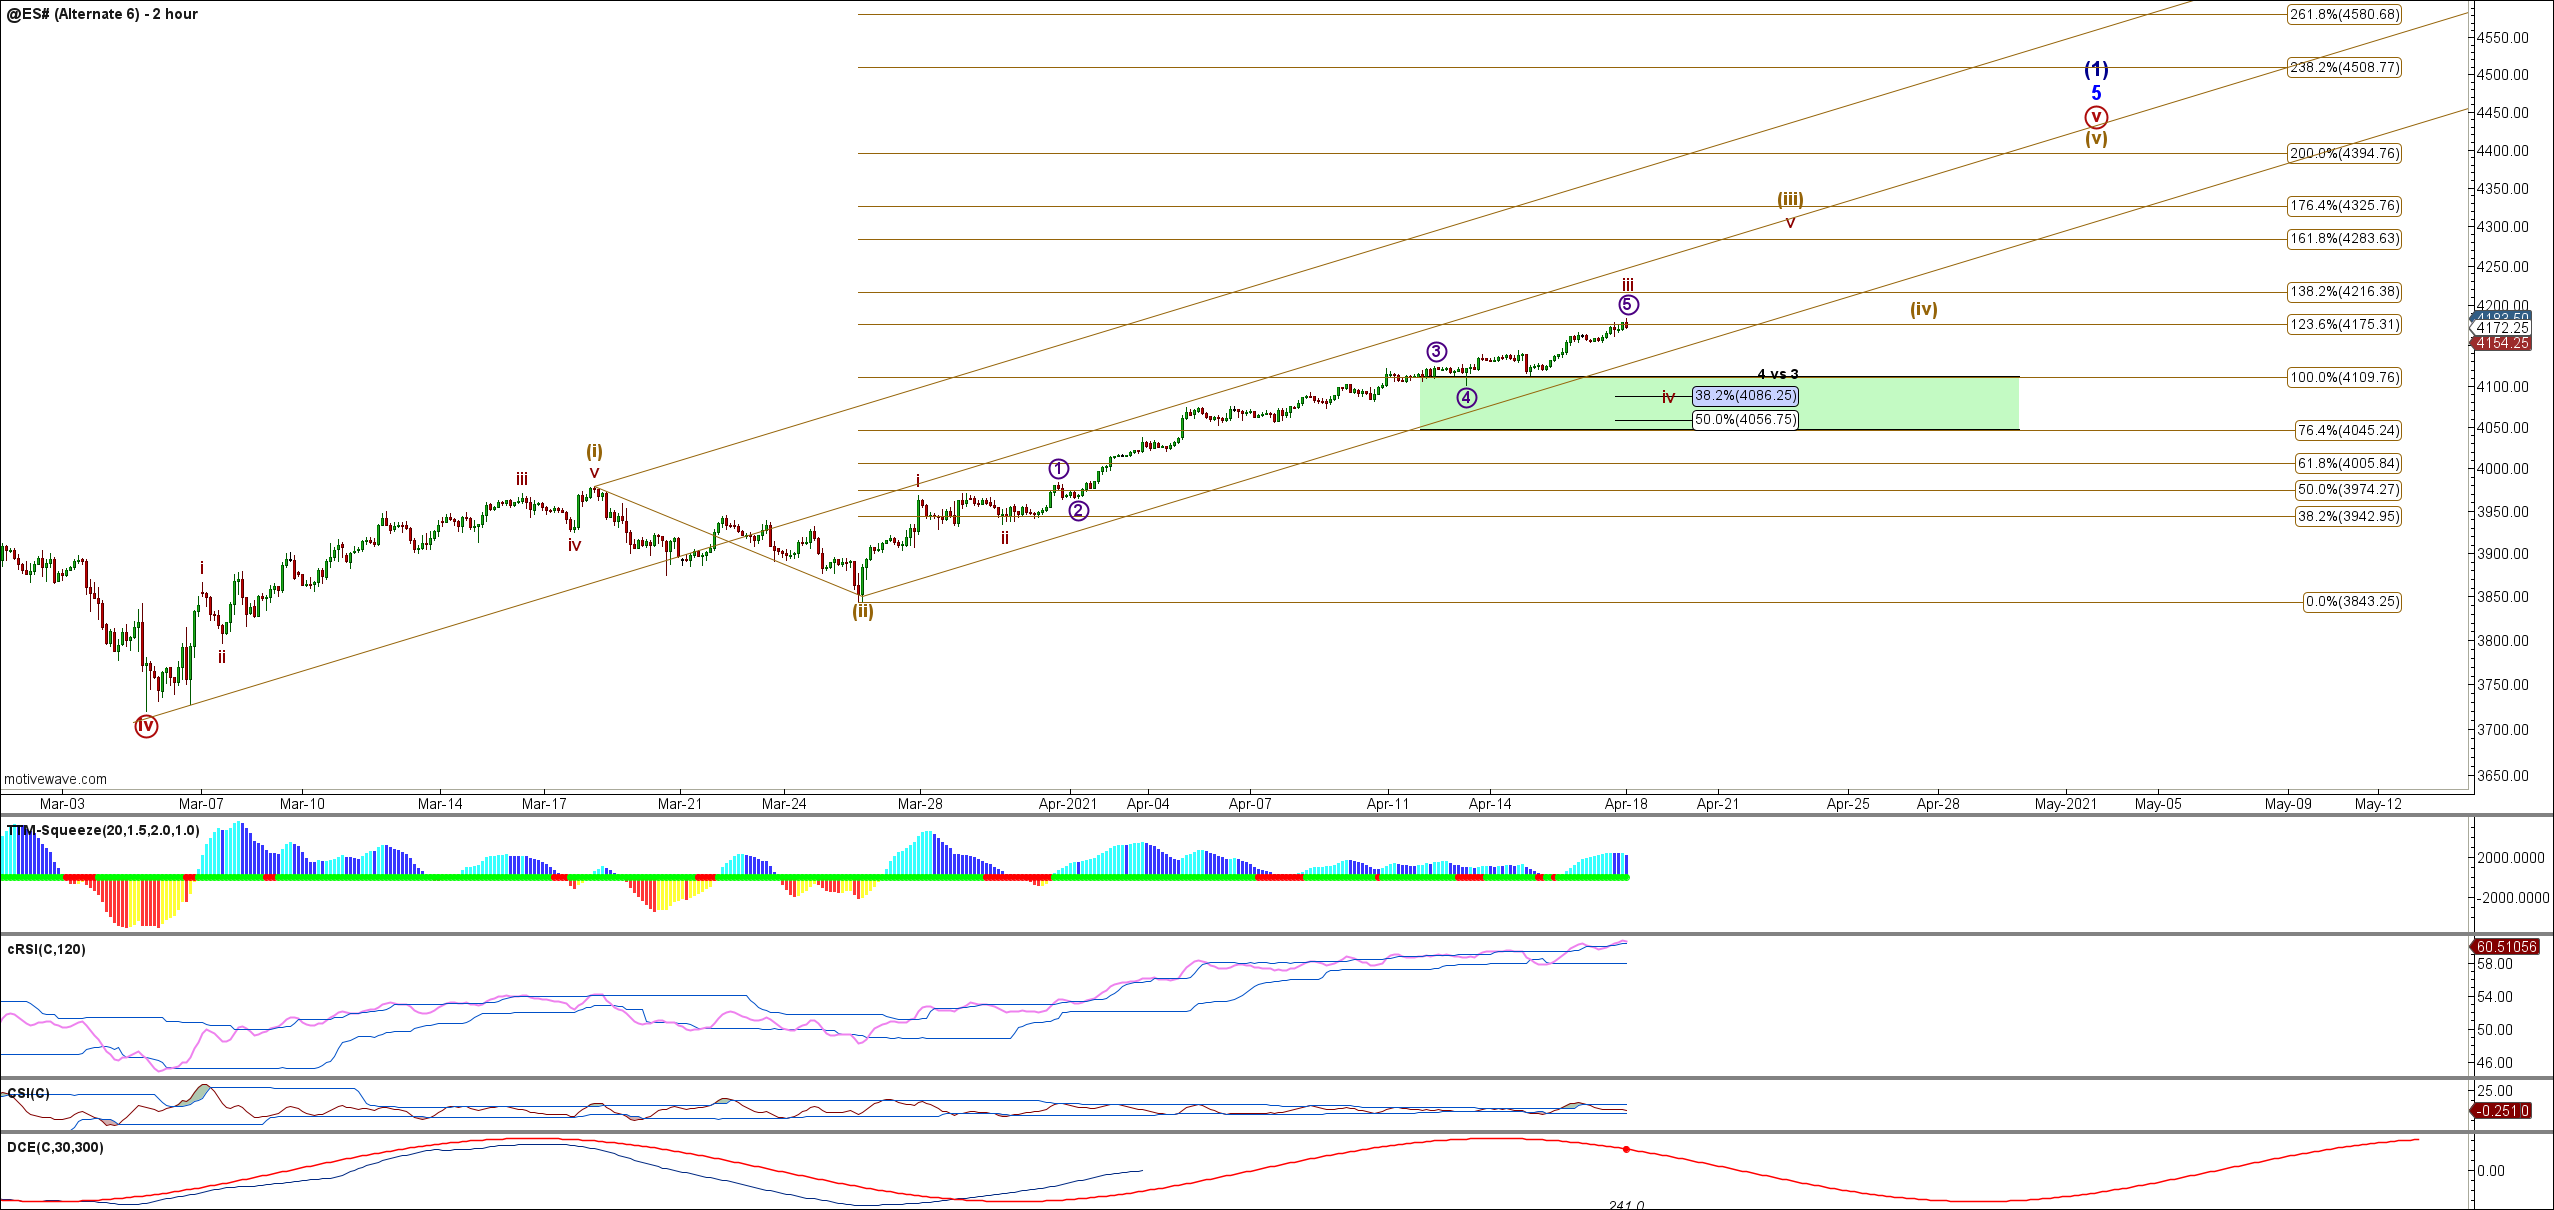
The ES put in a local high back in September to complete the Minute Degree Wave a of Minor Degree Wave 3 then pulled back in three waves into the low on 31st October 2020 completing the Minute Degree Wave C. The move up off that October low again counts best in 3's thus we are likely seeing an ending diagonal for the Minute Degree Wave C of Minor Degree Wave 3. Support is now at 4070 - 4122 ES (June Contract Basis). Levels to watch above are 4206 then 4258.
At this point and particularly given the pattern off the March 5th 2021 low it is sensible to consider the path, targets and key support levels should we simply continue higher from here. On the smaller time frames (120 Minute down through 5 Minute) this is actually surprisingly simple. Key immediate support is at 4150/52 ES and below that 4086 - 4110. It would take a break back below 4045 to start to consider this count then breaking down which is interesting as that is where the current Gamma Zero/Neutral level resides.
We started to see the ES pullback following a 20 Minute & 120 Minute cRSi sell signal towards the end of Fridays session which will likely see the ES continue lower during the coming week. Expecting to see the upper support levels hold followed by further highs to at least 4258 area in the diagonal count and ultimately to the 4395 level or higher in the more immediately bullish impulse count off the March 2020 lows. In either count this would then complete either an Intermediate Degree Wave (1) of a Primary Degree Wave 5 OR possibly all of an Intermediate Degree Wave (5) of the Primary Degree Wave 3 in which case we will likely re visit last years lows rather than holding a retrace as shown in the Daily Chart."
Trading wise we banked profits on our most recent swing long position entered on 25th March 2021 following a 120 Minute cRSi Cycle sell signal back on the 8th April for an additional 17.62% gain in SPXL this year bringing the compound gains since the start of 2021 to 98%. We are now looking to take another swing long position after a pullback into support should we see the requisite cRSi buy signal after a cycle bottom and preferably supported by a squeeze indicator buy signal on the 120 Minute time frame.