| Posted by Mike Richards on 09/10/2018 | 0 Comments |
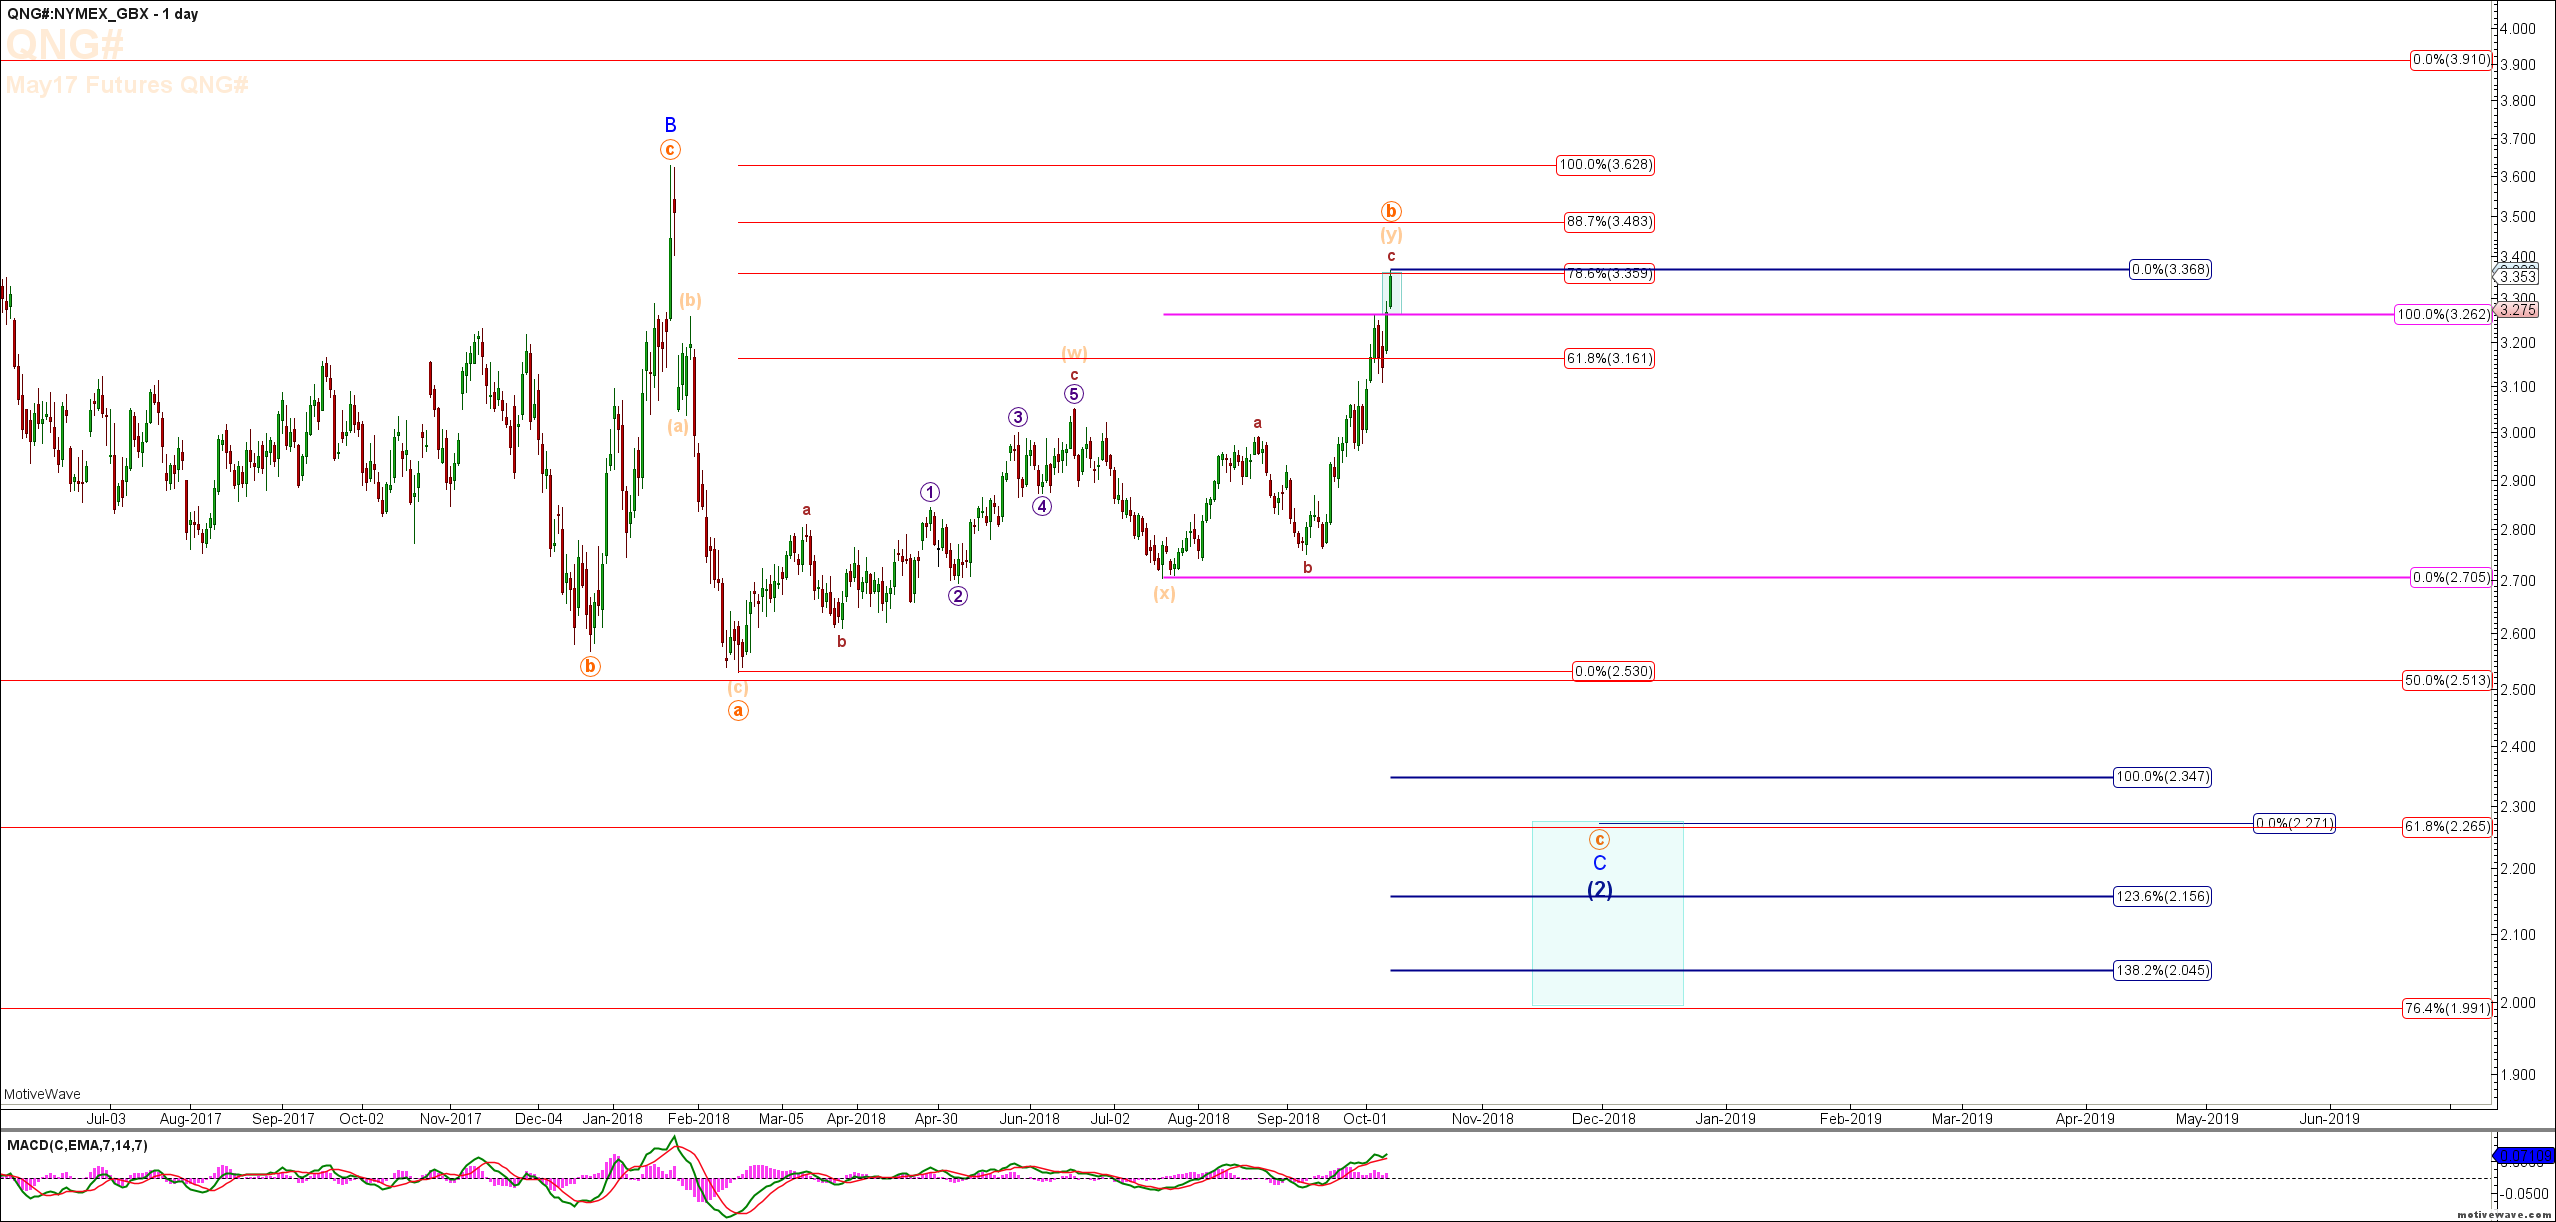
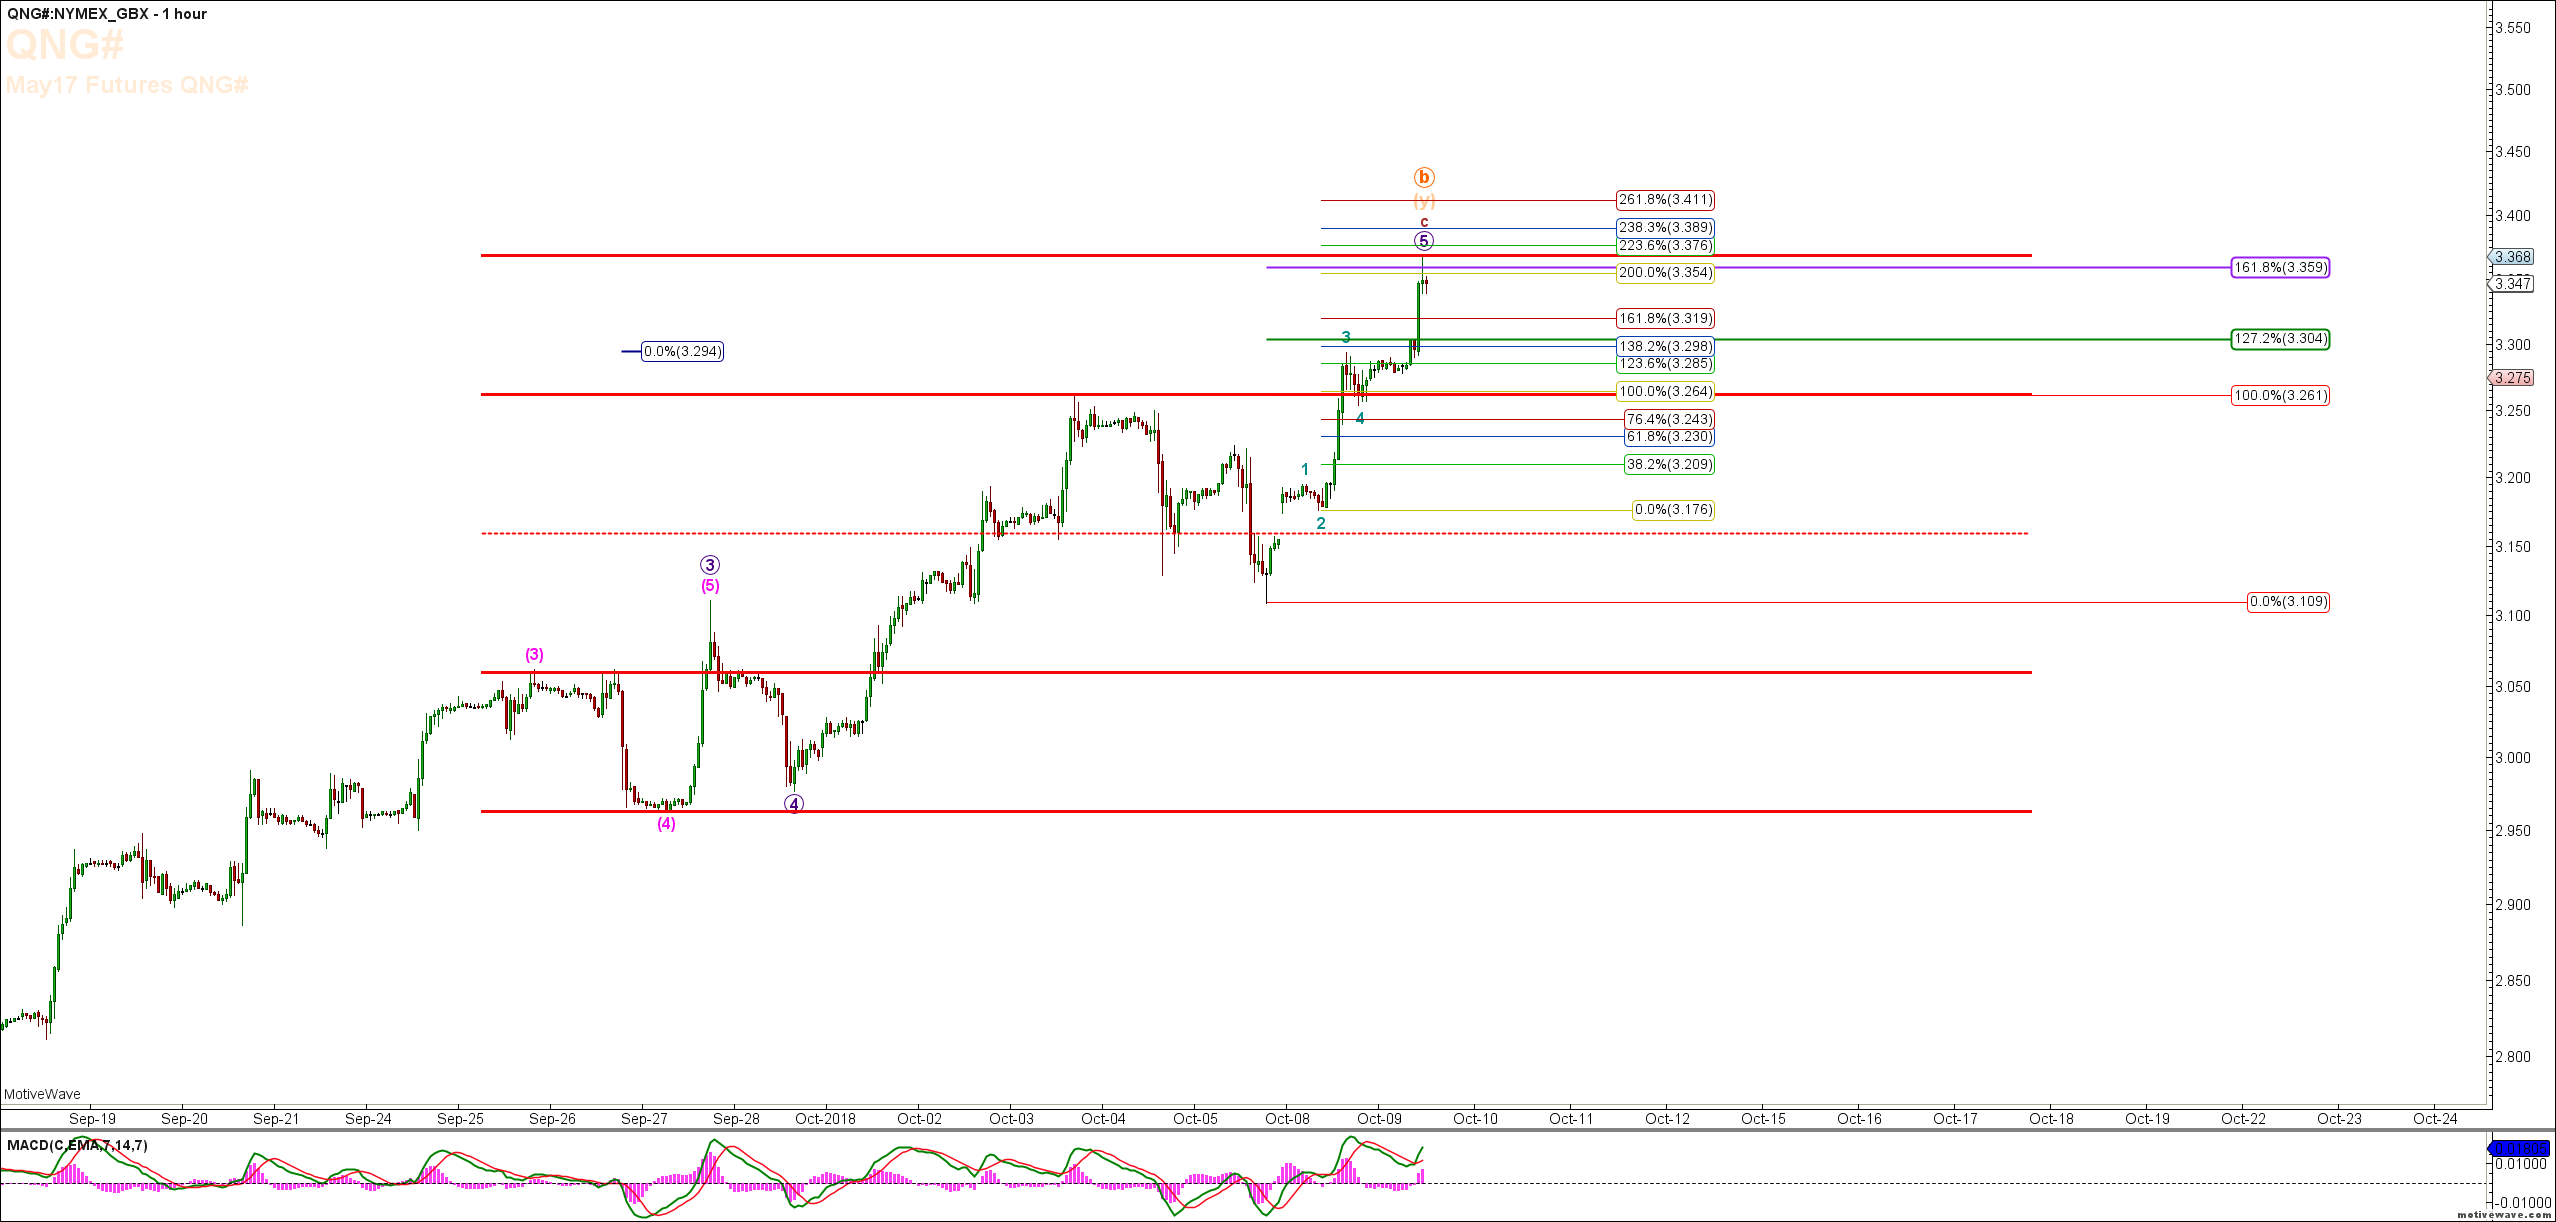
In looking at these extensions up in NG, I think it's trying for a price target of 3.453. Supportive of this is - 1. It's the 3.618 extension for the (c) wave, a common fib for NG, as shown on the 60 minute chart; 2. It's slightly over the .786 retrace, which I've noticed that NG does a lot - spikes just over the .786; 3. It lines up as a spike just over where the (Y) wave is 1.382 x the (W) wave; and 4. The overall 1.382 for the larger (Y) wave lines up spot on the overall .886 retrace level.
If this is correct, the c-wave down will be incredibly fast and furious - perhaps even moreso than this most recent move up has been. Take a look a the preceding a-wave, where the drop that occurred took NG from 3.668 down to 2.533, or 1.14, which is a 31% drop in value in only 17-days.
If this count is correct, I would expect NG to top most likely this week, and to complete a move down to 1.88 fairly quickly. It will take longer than the a-wave, as the c-wave will have one more set of 4/5's.
I am aligned with Brians comments below copied from his thread in NG.
In looking at these extensions up in NG, I think it's trying for a price target of 3.453. Supportive of this is - 1. It's the 3.618 extension for the (c) wave, a common fib for NG, as shown on the 60 minute chart; 2. It's slightly over the .786 retrace, which I've noticed that NG does a lot - spikes just over the .786; 3. It lines up as a spike just over where the (Y) wave is 1.382 x the (W) wave; and 4. The overall 1.382 for the larger (Y) wave lines up spot on the overall .886 retrace level.
If this is correct, the c-wave down will be incredibly fast and furious - perhaps even moreso than this most recent move up has been. Take a look a the preceding a-wave, where the drop that occurred took NG from 3.668 down to 2.533, or 1.14, which is a 31% drop in value in only 17-days.
If this count is correct, I would expect NG to top most likely this week, and to complete a move down to 1.88 fairly quickly. It will take longer than the a-wave, as the c-wave will have one more set of 4/5's.
 Login or start your Free Trial to see the Day Trade Chart for NG and access all of our in-depth charts, Elliott Wave setups, Fibonacci Levels, Hurst Cycles, and more including our Live Trading Room where you watch our screens as we trade live and show you the market direction in real time.