| Posted by Mike Richards on 13/08/2022 | 0 Comments |

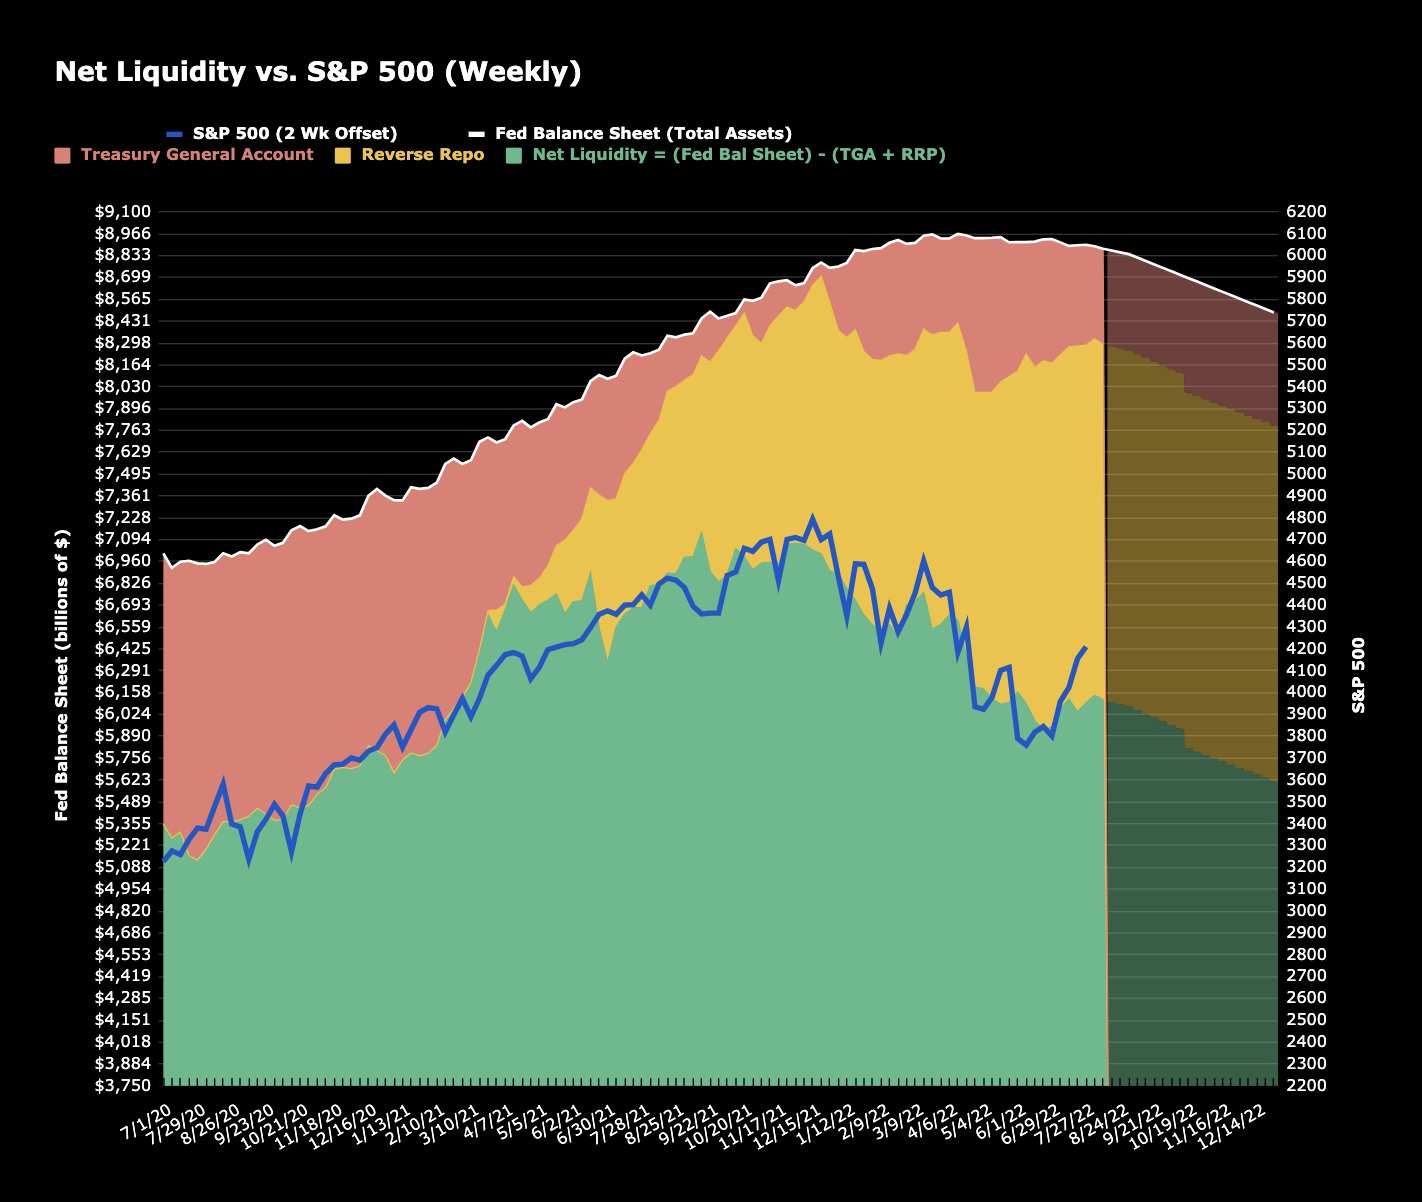
A a metric based on a calculation of Net Liquidity suggests that the SPX is now over 300 Points "Over Valued" which represents the largest deviation seen at any time over the last two years. So, how to we come to this assessment and how useful has this been in recent times? FED followers have traditionally tracked the Feds balance sheet and the Fed Fund Rate, the theory being that these are the central driving forces behind the markets. These matrices have certainly been of relevance especially since the advent of QE going back to 2009. Since 2020 the system has changed. The Fed went into overdrive and printed a whopping 4.5 Trillion Dollars. This was an un precedented avalanche of money which had the effect of roughly doubling the size their balance sheet. This was widely broadcast and known but what was less obvious was the Treasury deciding to provision itself with a whopping 1.8 Trillion Dollars in Reserves, 4.5 times the previous largest amount ever held at the Treasury General Account (TGA). Over the course of 2020 & 2021 the liquidity flows from the FED and Treasury combined fuelled a stupendous market rally. This came to an abrupt halt as we entered 2022. The Treasury curtailed its flow of shorter dated paper that typically facilities the Primary Dealers proving liquidity to both the Stock & Bond Markets while the FED simultaneously raised the award rate on the Reverse Repo Deposits thus resulting in over 2 Trillion of liquidity getting sucked into Reverse repo Accounts. This was six times more than we have ever seen in the past.
In the past we have been able to simply use the size of the FEDs balance sheet as a rough but usable metric for Net Liquidity. Now, we need to consider the Reverse Repro Account combined with the Treasury General Account as part of the equation, thus:
Net Liquidity = Fed Balance Sheet -(TGA + RR).
The chart above shows the calculated Net Liquidity VS The S&P 500 offset backwards by two weeks over the last two years. The correlation is 95%. This demonstrates that a change in Net Liquidity correlates to a range in asset prices two weeks forward with a historical accuracy of 95% based on the current regime.
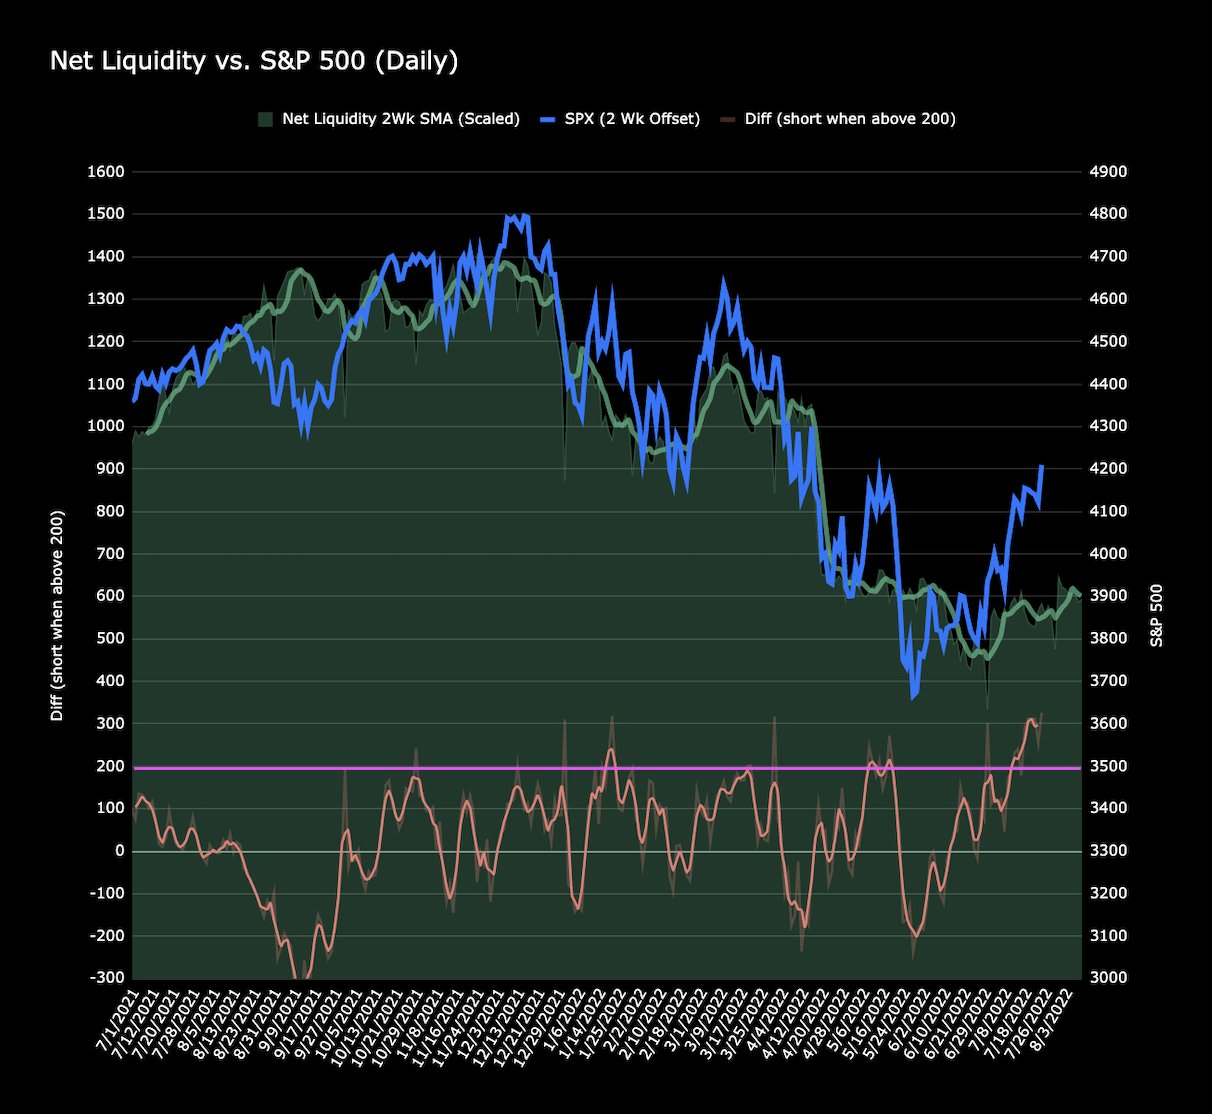
 Looking at the Daily Chart of the same Net Liquidity vs the S&P 500 with the same 2 Week offset and plotting the Differential in the lower view panel we can also ascertain that when the divergence becomes greater than 200 SPX Points we have seen sharp downside moves in the Stock Index. Currently the differential is >300 points .

Cycles:
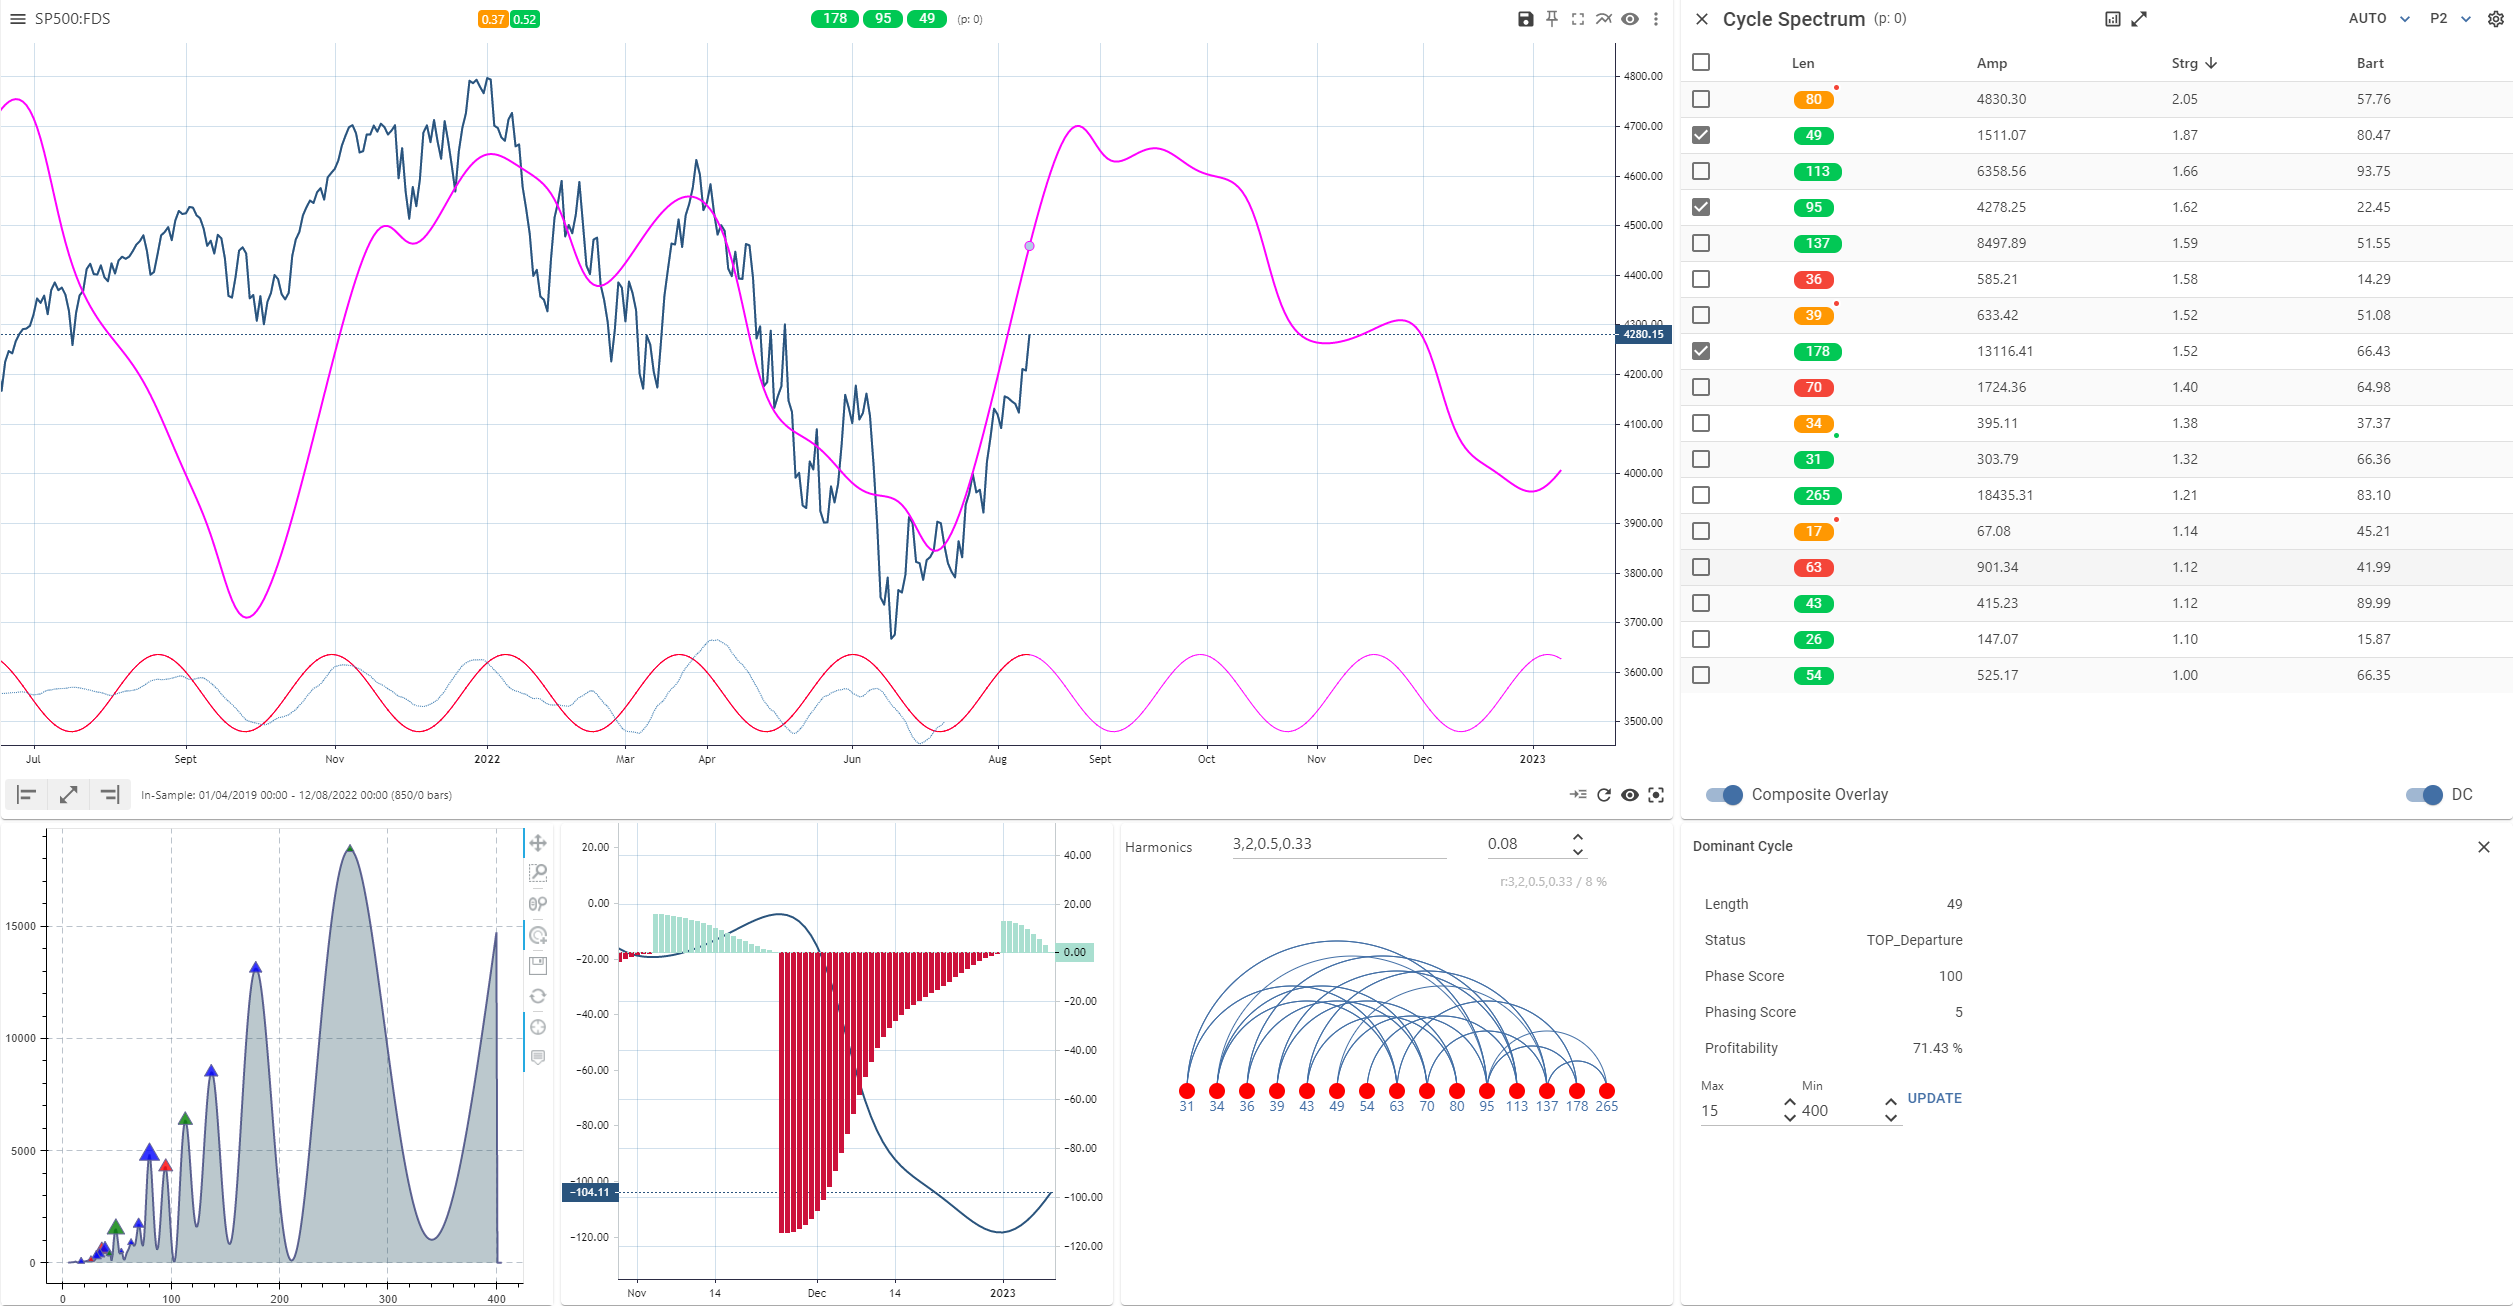
A look at the Daily Composite Cycles analysis for the S&P 500 Index suggests that the current move up that started back in mid June is likely corrective and has less than two weeks more to run before we see the Cycles turn sharply lower once more.

Price Pattern:
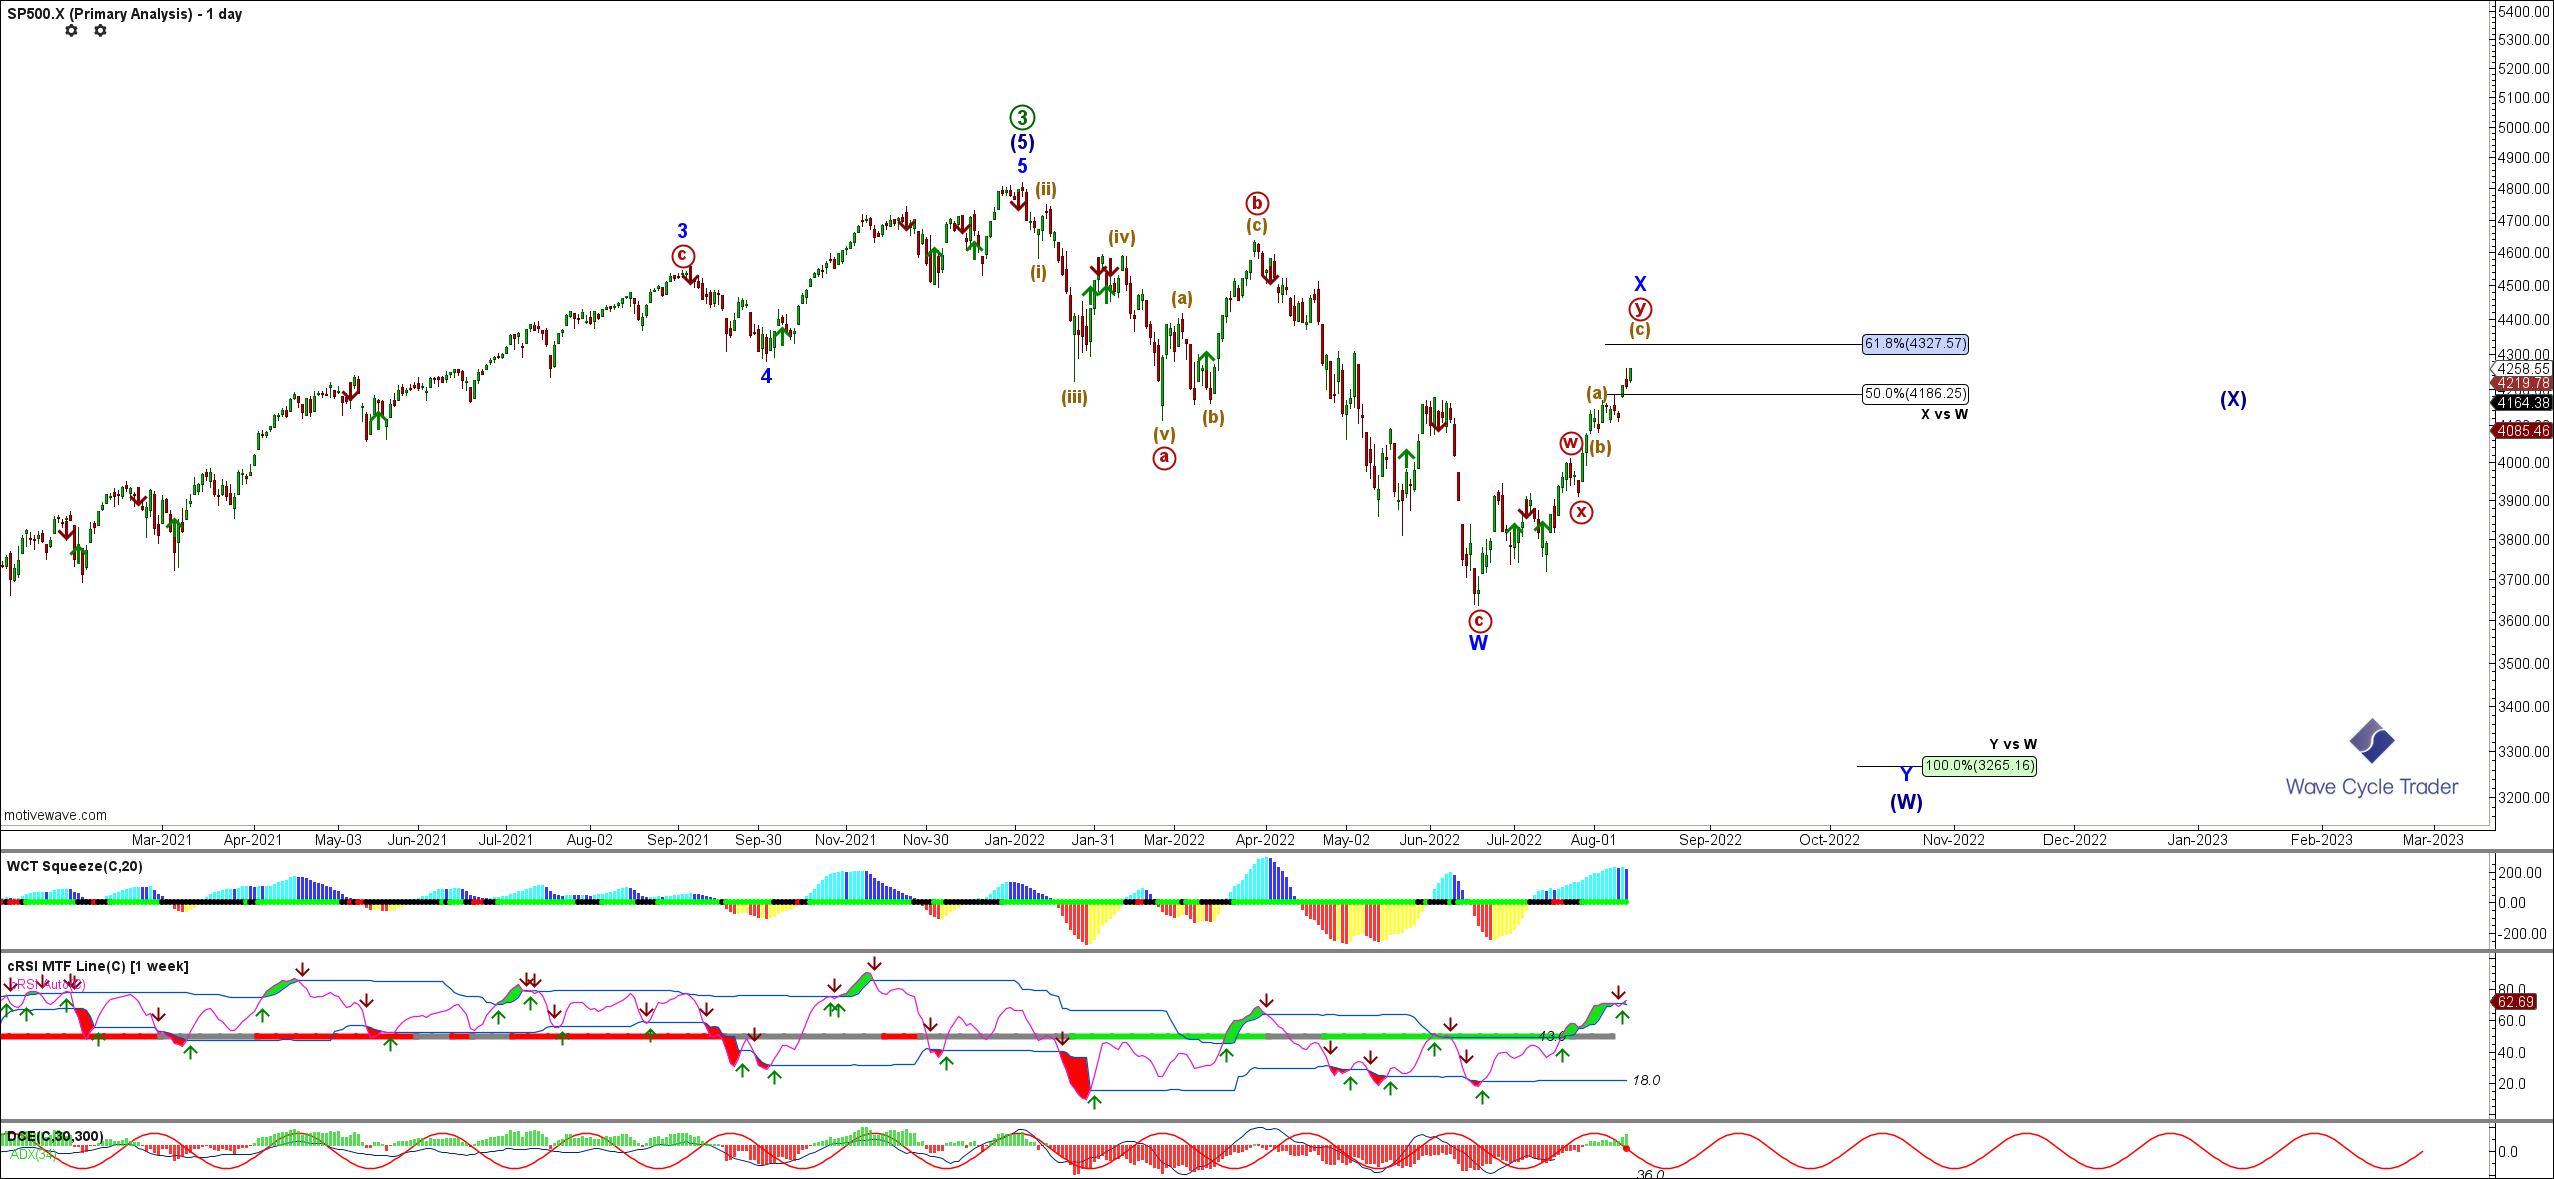
Looking at our Daily Chart for the S&P 500 Index, we can see that this upside correction is now approaching the 61.8% retrace of the move down off the all time high seen in early January 2022. Again, we expect to see the index continue too chop marginally higher over the coming week or so and then turn lower.