| Posted by Mike Richards on 27/09/2022 | 0 Comments |

New Home Sales - also known as "New Residental Sales" - is an economic indicator that measures sales of newly built homes. New home sales data is one of the best leading indicators of the housing market. When new home sales data shows a significant decline, telling us not only that new homes being built are not selling, but also that people who started building a home are no longer buying the completed homes, it is a clear indication of a slowdown in the housing market and a possible recession.
That is the usual reading of this data set. However, cycle analysis allows us to delve deeper on this data set. Since the selling and buying of houses is also a kind of sentiment measurement of market participants, it is a good candidate for cyclical movements.

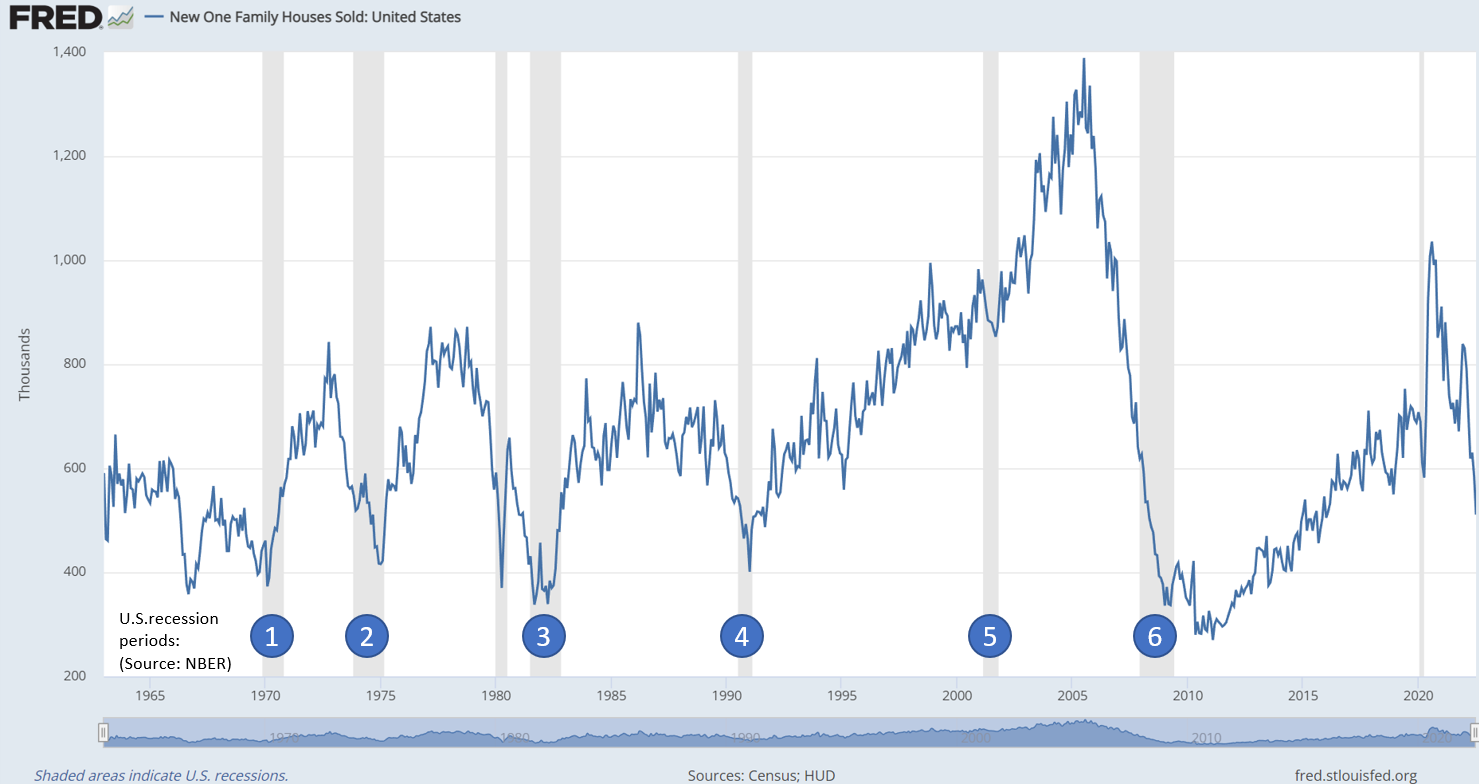
The next chart shows the raw New Home Sales dataset from 1960 up to today. The grey shaded areas indicate official periods in time where an U.S. recession took place. The data is published by the US Census Bureo¹, visualized here via the St. Louis Fed dataservice “FRED”².
Let us first focus on the areas highlighted as "U.S. recessions" in this series. Labeld as points no. 1-6 at the bottom of the chart.
First, it is important to clarify that these gray periods are "fixed" periods determined after the fact and are not derived from the "New Home Sales" data set shown in blue. They would appear the same if overlaid with other data series. These recession periods are nominated and published by the "National Bureau of Economic Research" (NBER).
“The NBER’s Business Cycle Dating Committee maintains a chronology of US business cycles. The chronology identifies the dates of peak and trough months in economic activity. The peak is the month in which a variety of economic indicators reach their highest level, followed by a significant decline in economic activity. Similarly, a month is designated as a trough when economic activity reaches a low point and begins to rise again for a sustained period. […]
The NBER's traditional definition of a recession is that it is a significant decline in economic activity that is spread across the economy and that lasts more than a few months.”
It is thus clear to see that
sharp declines in the New Homes Sales lead to U.S. recessions and
bottoming areas and their turning points indicate the end of an U.S. recession.
The periods of recession are hard-labled dates by the NBER and do not follow a cyclic model. But what if we could use this dataset to derive a composite cycle model that might be able to correlate with past major turns in the New Home Sales series? If we can find a cyclic model where the bottoms follow a cyclic behaviour - then we have a cyclic model which correlates to the hard labled U.S. recession periods. The beauty of this cyclic model would then of course be that we can use it to project the cycles into the future to spot the next possible bottom. Or in other words the next expected point in time where the next U.S. recession might come to an end.
Let's get our hands dirty and get to the table of cycle analysis.

We use our cycle analysis technique to identify the dominant cycles in this dataseries. The cycle spectrum analysis shows us clear cycles with a period of 83, 103, 65, 180 and 274 month:

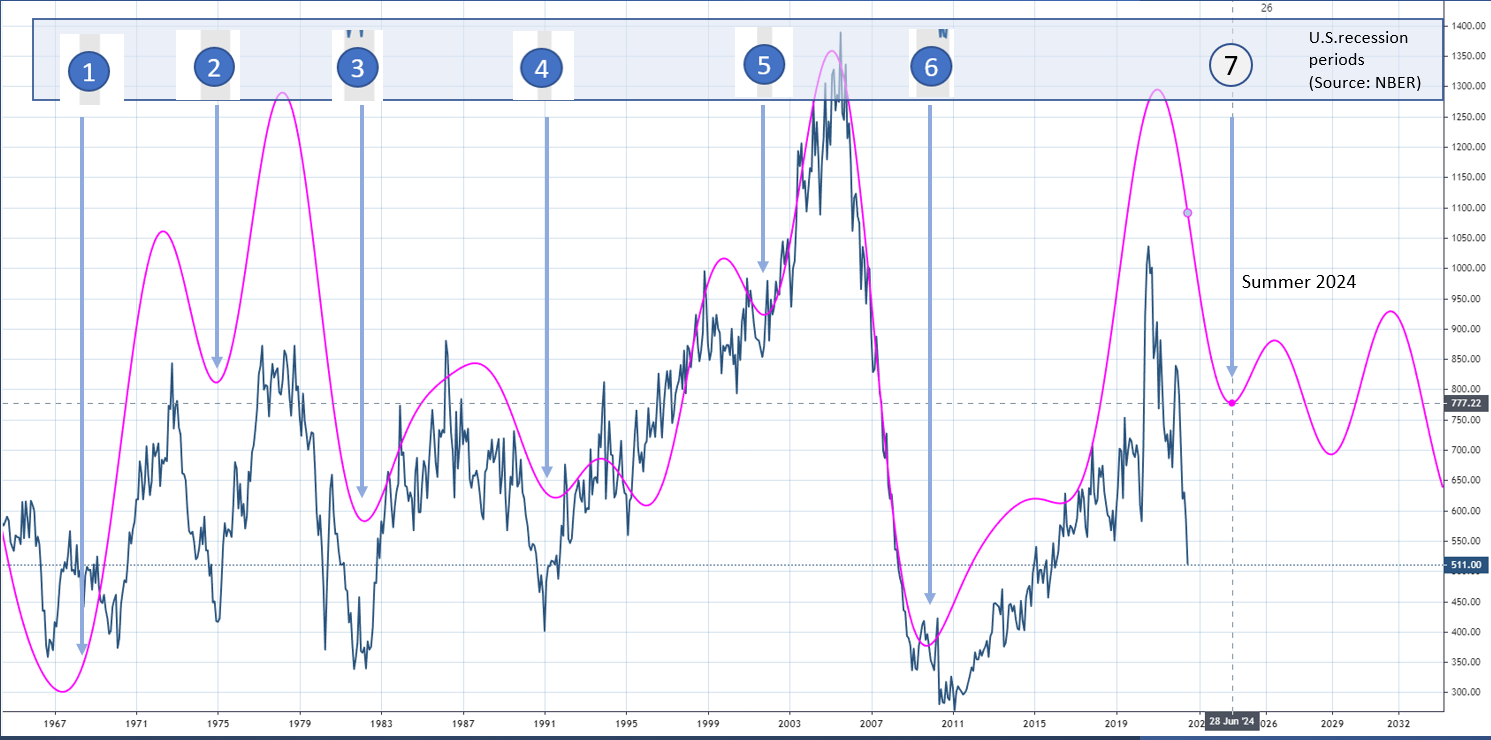
In cycle analysis, one would simply "select" these 5 dominant cycles with their respective phase and create a composite cycle model. In a composite cycle model, all 5 cycles are simply added on top of each other. Finally, the result of this composite cycle model is plotted as an overlay on the data series. The line in fuchsia shows the composite cycle model.
The correlation of the composite model with the New Home Sales is 0.81 - which is a very high correlation in regards to turning points.
Even more interesting is that almost all of the lows in this composite model coincide with past lows in the New Home Sales series, and these in turn correlate with the NBER label of U.S. recessions! The NBER counting for gray areas of recessions are simply mapped with the lables 1-6 from the first FRED chart. And the arrows show how perfect they are in-sync with composite cycle lows.
The takeaway of this composite cycle analysis is quite simple: Yes, we are heading into a recession in the U.S., and second and more important, the cyclic model predicts the bottom of this recession to be expected for summer 2024.
This article was written by Lars von Thienen