| Posted by Mike Richards on 16/10/2018 | 0 Comments |
 Bit Coin put in an all time low back in August 2010 at 0.03 relative to the US Dollar. From there we have seen a spectacular rise in both the price and the euphoric sentiment attached to this relatively new instrument and indeed Crypto Currencies in general. The sentiment crescendo d into late last year when Bit Coin reached an all time high of 19918 before commencing a complex multi month correction which has thus far seen this Major Crypto Currency trade as low as 5525. While this has lead to many becoming disillusioned and even calling for the imminent demise of this emerging sector there are as many still expecting further meteoric rises.
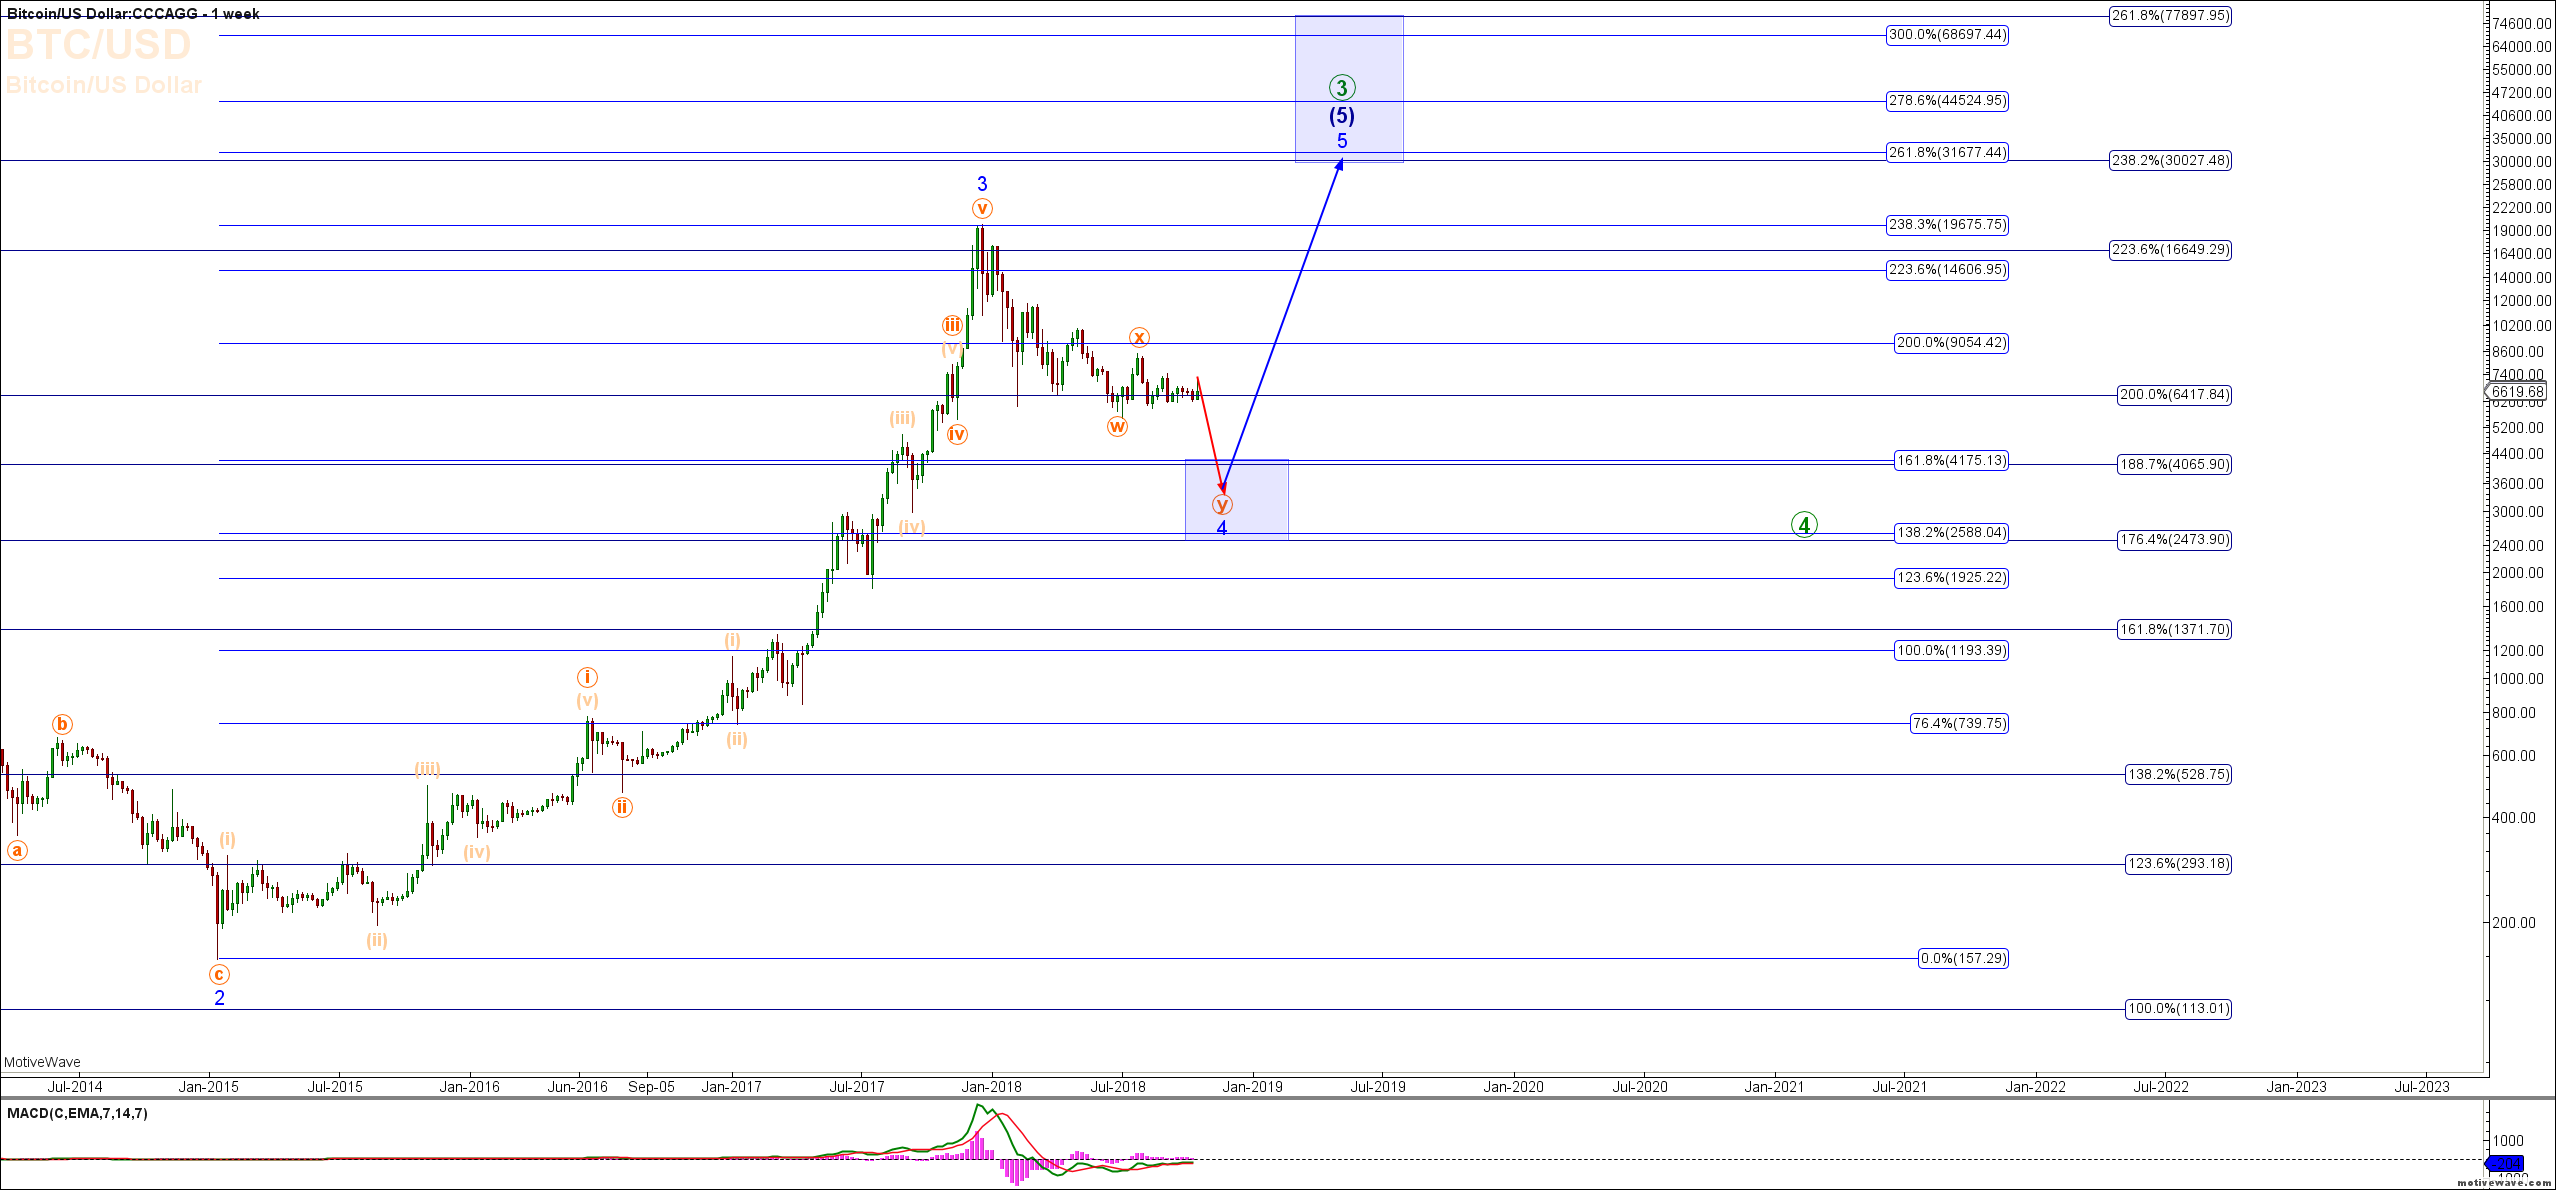
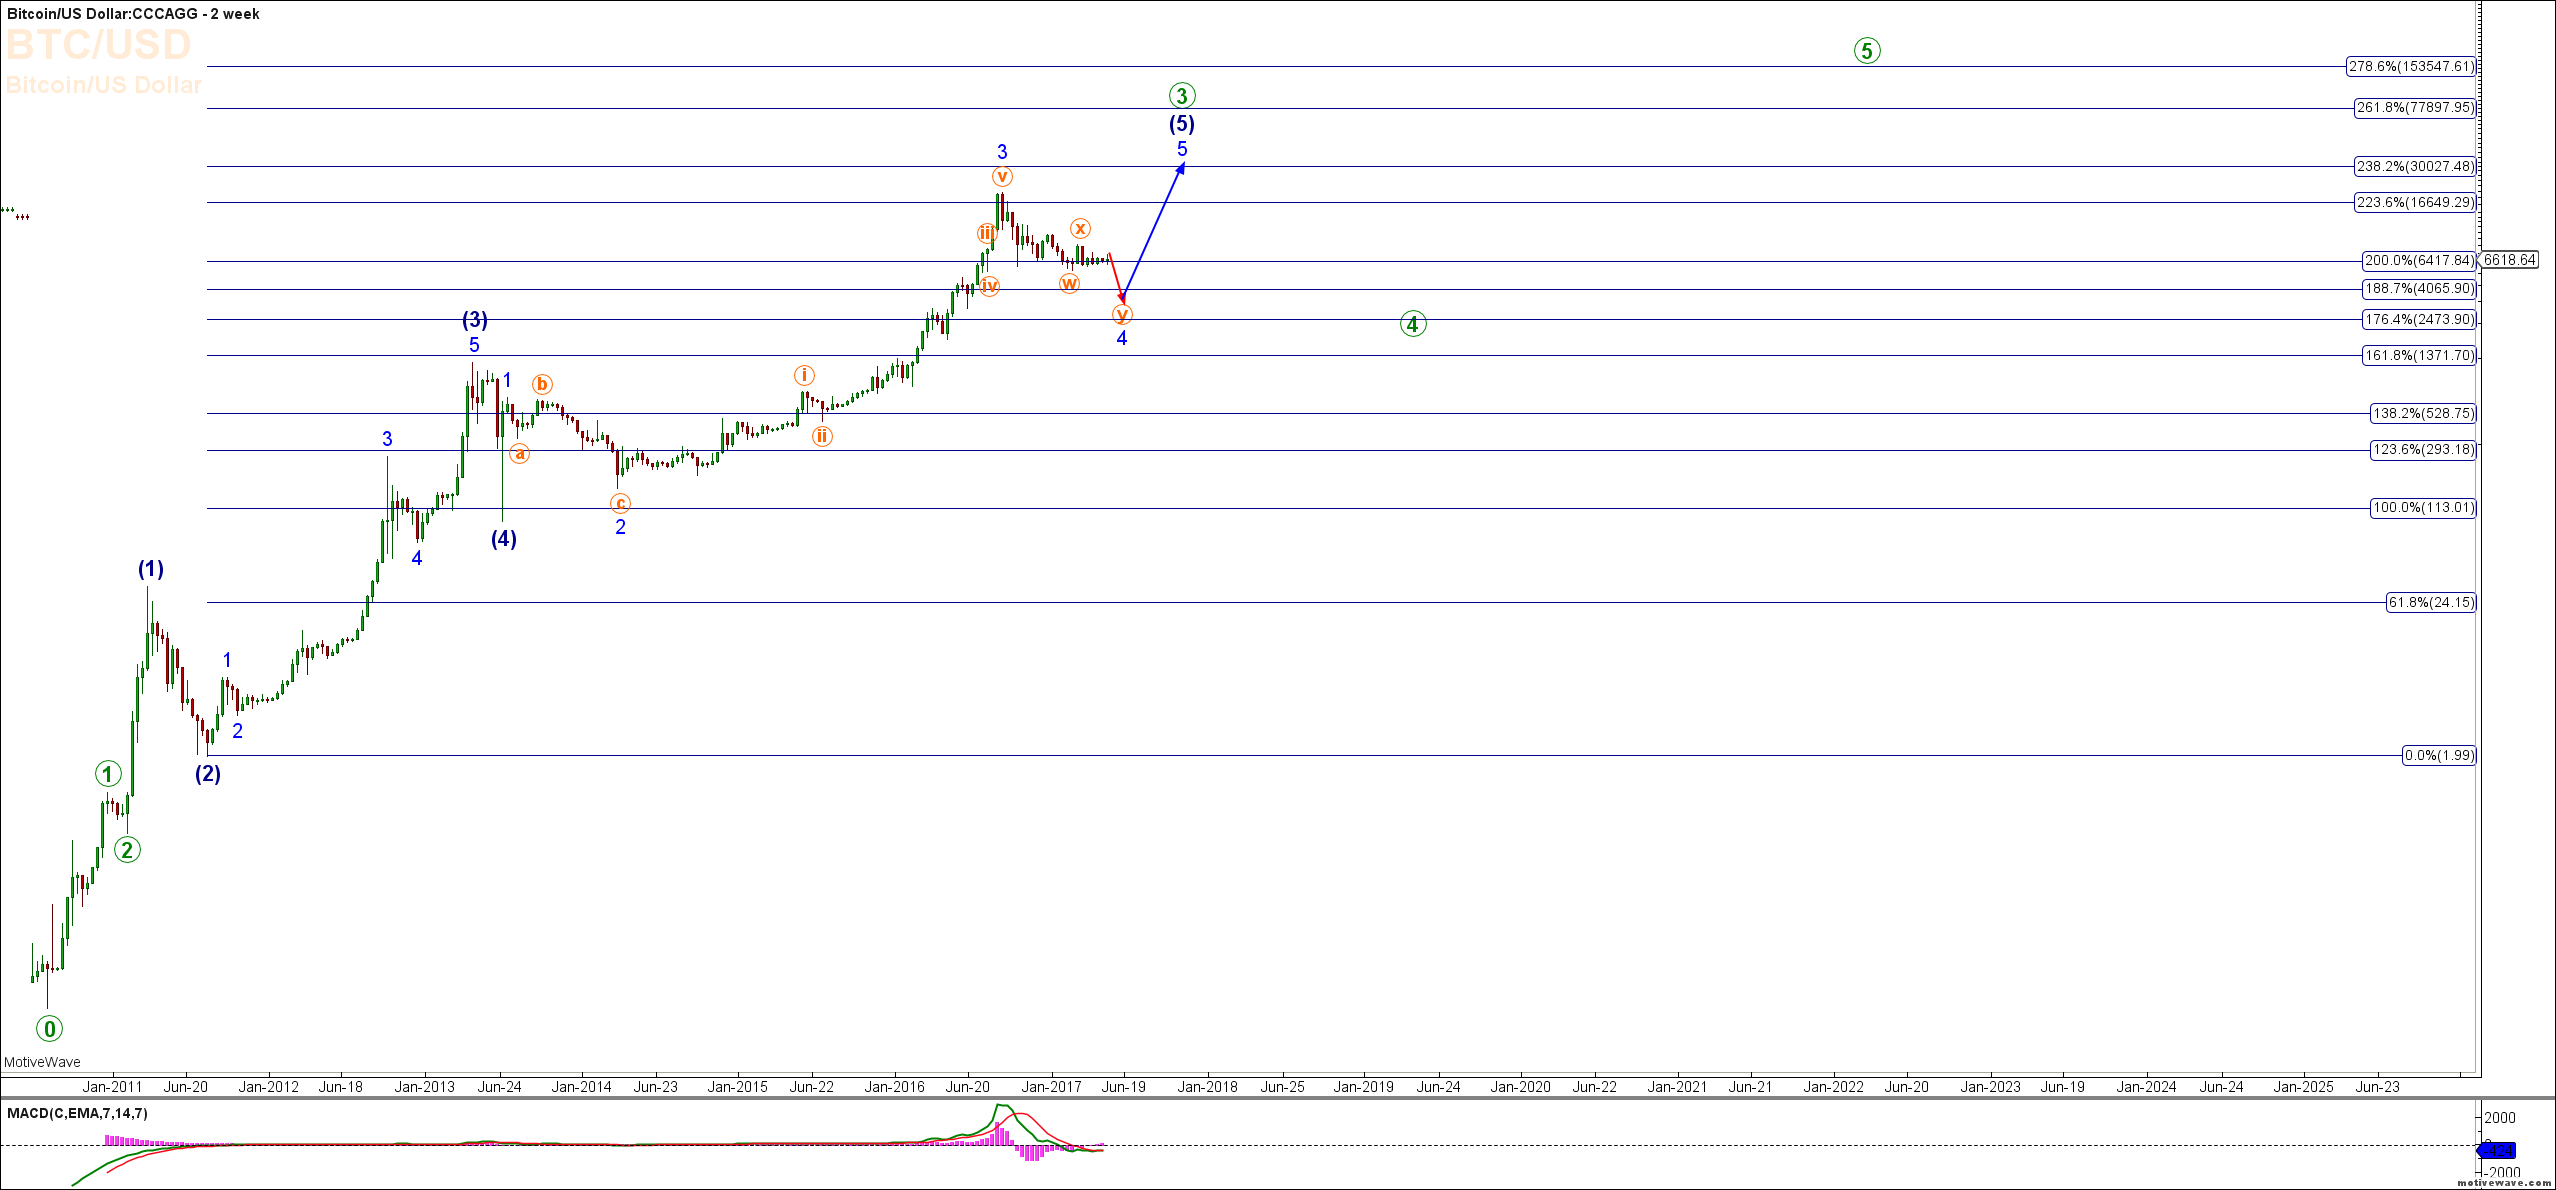
Elliott Wave is principally a study of mass human sentiment so Bit Coin is ideally suited to this particular analysis technique. Looking at the long term Bi Weekly Chart of Bit Coin relative to the US Dollar the currency appears to still be in its initial Primary Degree Wave 3 up from that all time low. Within that we can count all of the Intermediate Degree Waves (1), (2), (3) and (4) as complete and are thus within the Intermediate Degree Wave (5). Analyzing this final Intermediate Degree Wave (5) in more detail (Weekly Chart) we can also count the Minor Degree wave 1, 2 and 3 as having completed which suggests that the current move down is in fact corrective and more precisely is a Minor Degree Wave 4 upon completion of which we expect to see BitCoin push higher and exceed the December 2017 all time high.
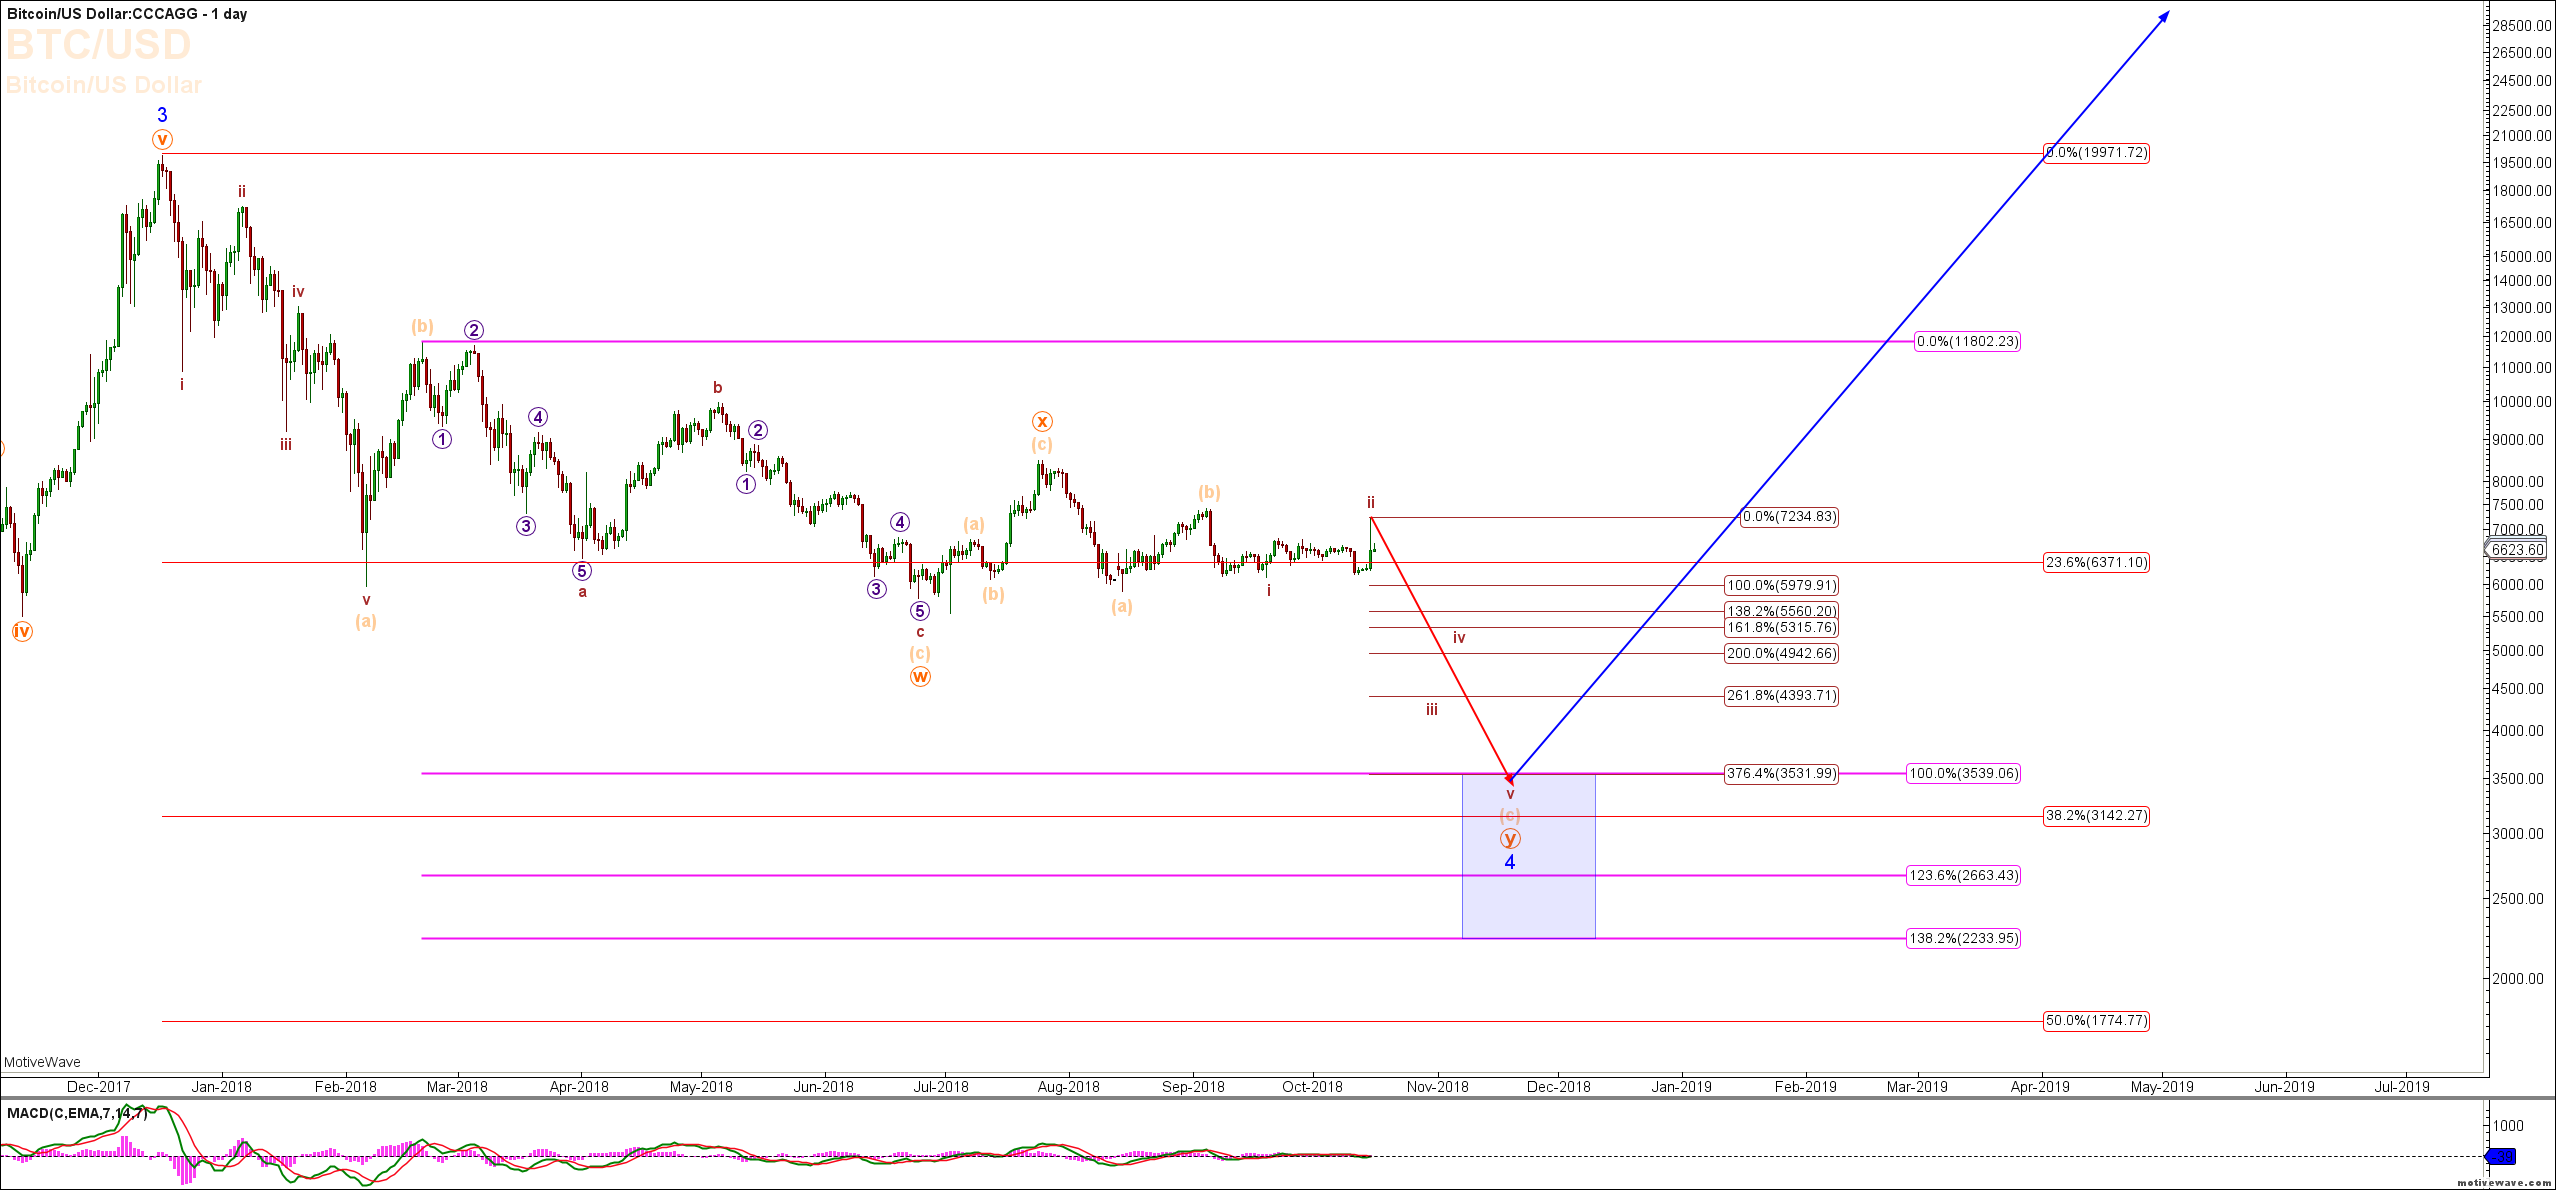
In conclusion, I expect to see BitCoin make another swing lower to complete the final sub wave of this drawn out Minor Wave 4 correction towards the 2488 - 4175 area before we then see the next swing to the upside. The target zone for the completion of all of Primary Degree Wave 3 is from 30027 to as high as 77897. On completion of the Primary Degree Wave 3 we would then expect to see Bit Coin revisit considerably lower levels before any further gains are seen. Considering this scenario there will continue to be plenty of ammunition for both sides of the extreme sentiment to hurl across Social Media platforms around the world for some time to come.
Login or start your Free Trial to see the Day Trade Chart for Bitcoin and access all of our in-depth charts, Elliott Wave setups, Fibonacci Levels, Hurst Cycles, and more including our Live Trading Room where you watch our screens as we trade live and show you the market direction in real time.