| Posted by Brian Fletcher on 24/01/2019 | 0 Comments |
The S&P 500 is setting up for extreme moves in 2019.
Extreme machinations in price offer investors opportunities for extreme profits.
Don't be afraid to exit positions and don't suffer from the "fear of missing out" syndrome.
In this article, I'll discuss the two primary paths for the coming machinations in the S&P 500 Stock Index and a view of how active investors and traders position to minimize losses and maximize profits.
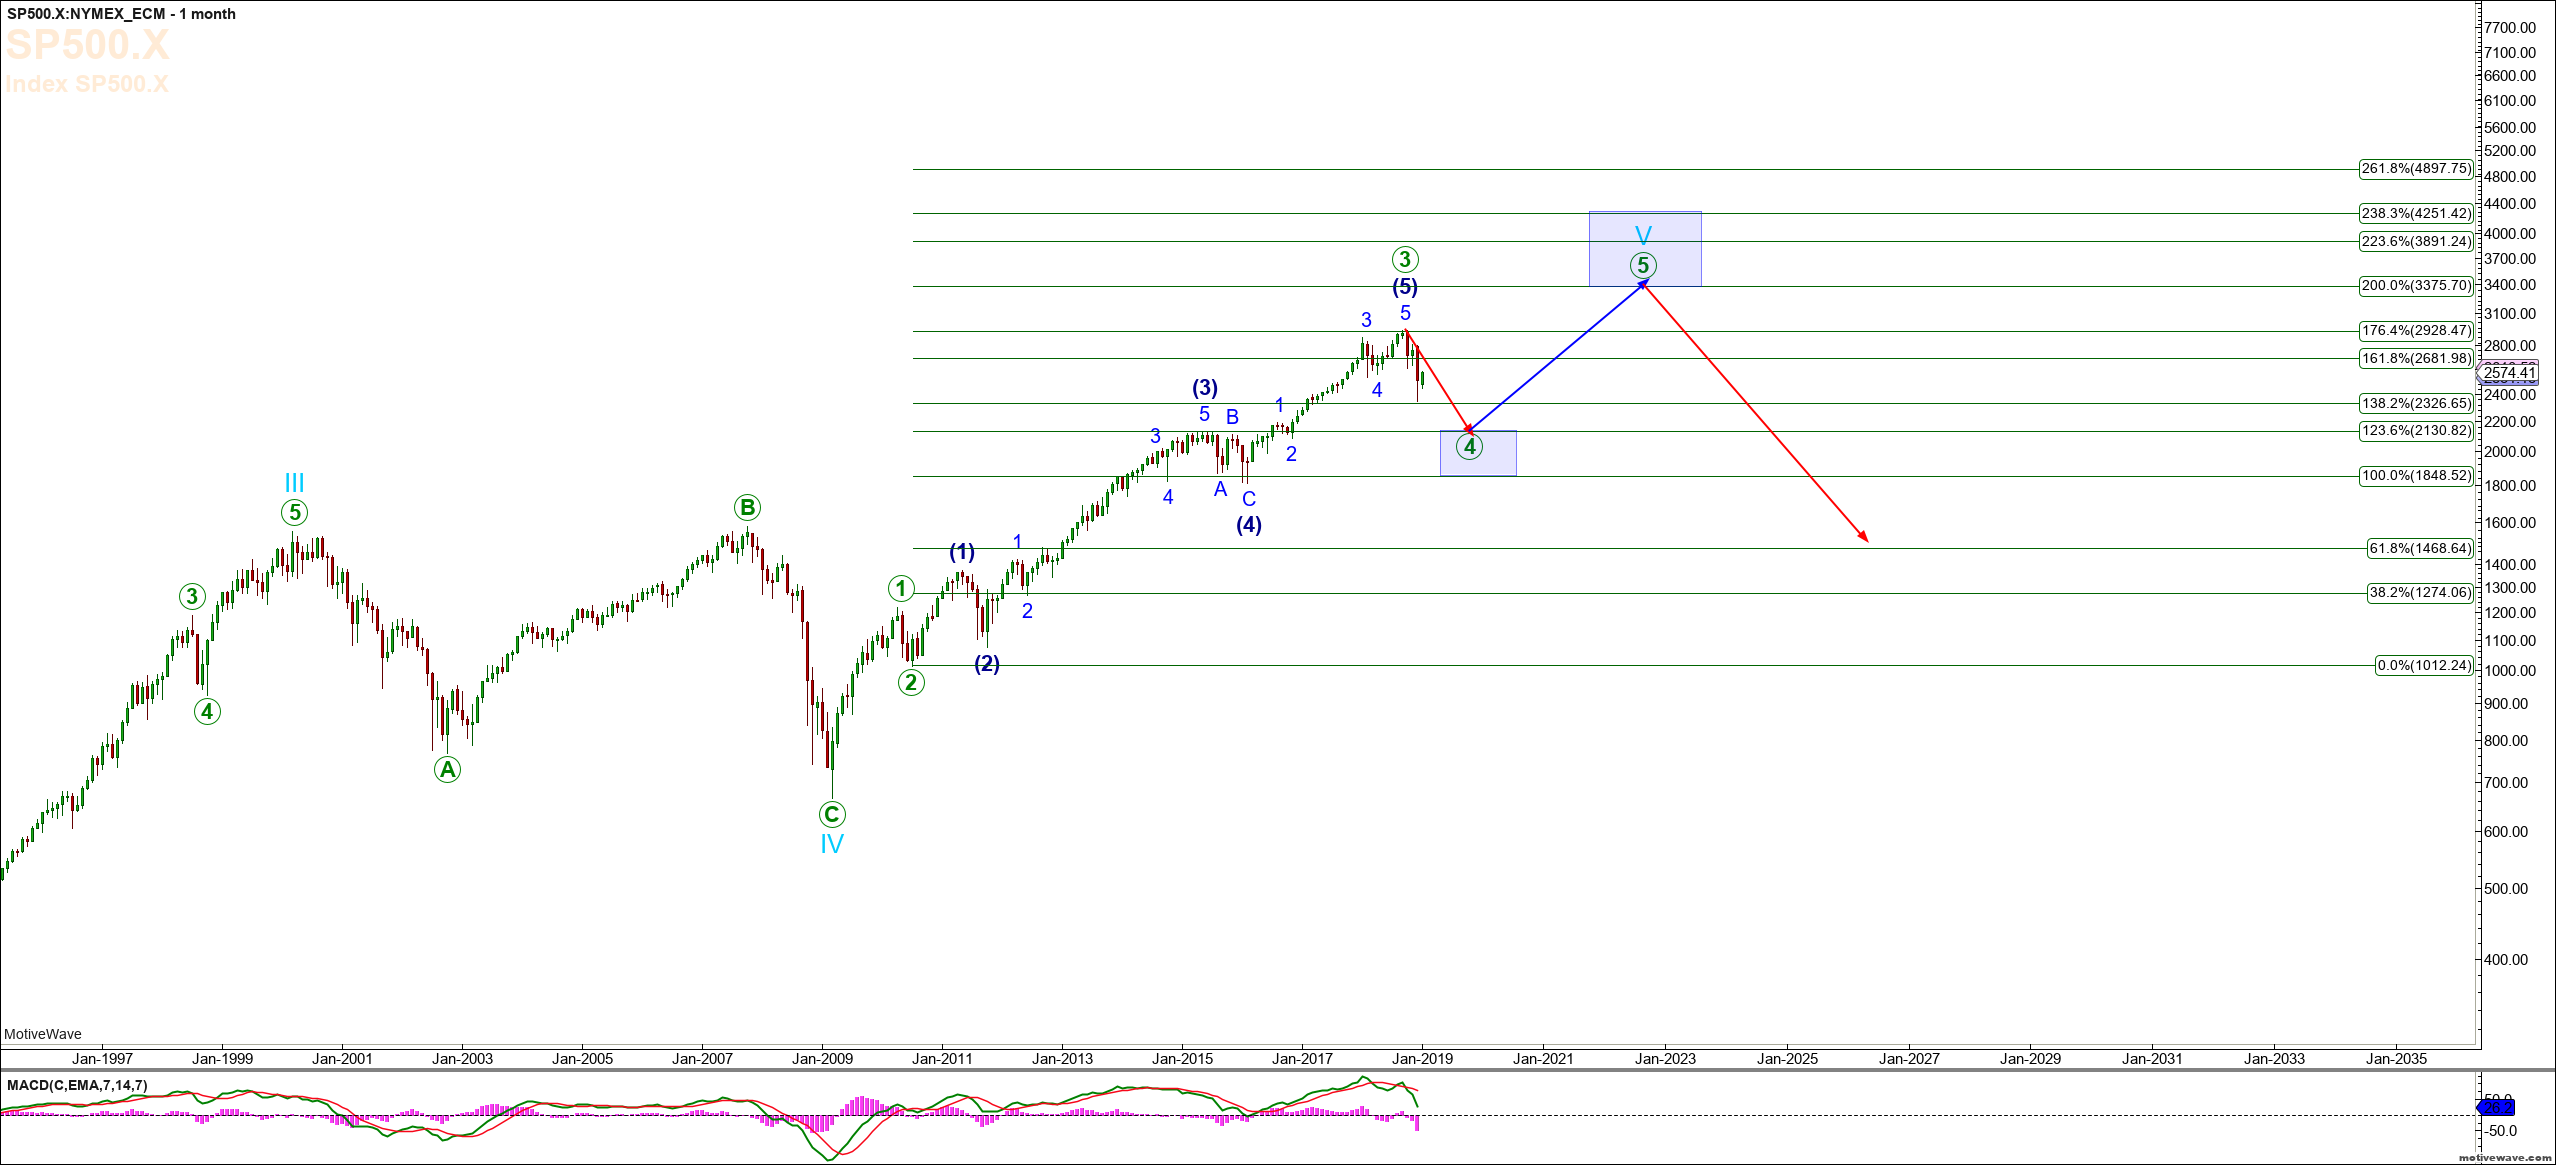
Let's start with the monthly chart showing the move up off the 2009 low (birds-eye view). What now seems clear is that the SPX has completed Primary Degree Wave 3 at the high seen on October 3, 2018, and is presently in a corrective 3-wave structure to lower levels, with our ultimate expectation for a move to the 2,245-2,094 region to complete Primary Degree Wave 4 before heading to new all-time highs.
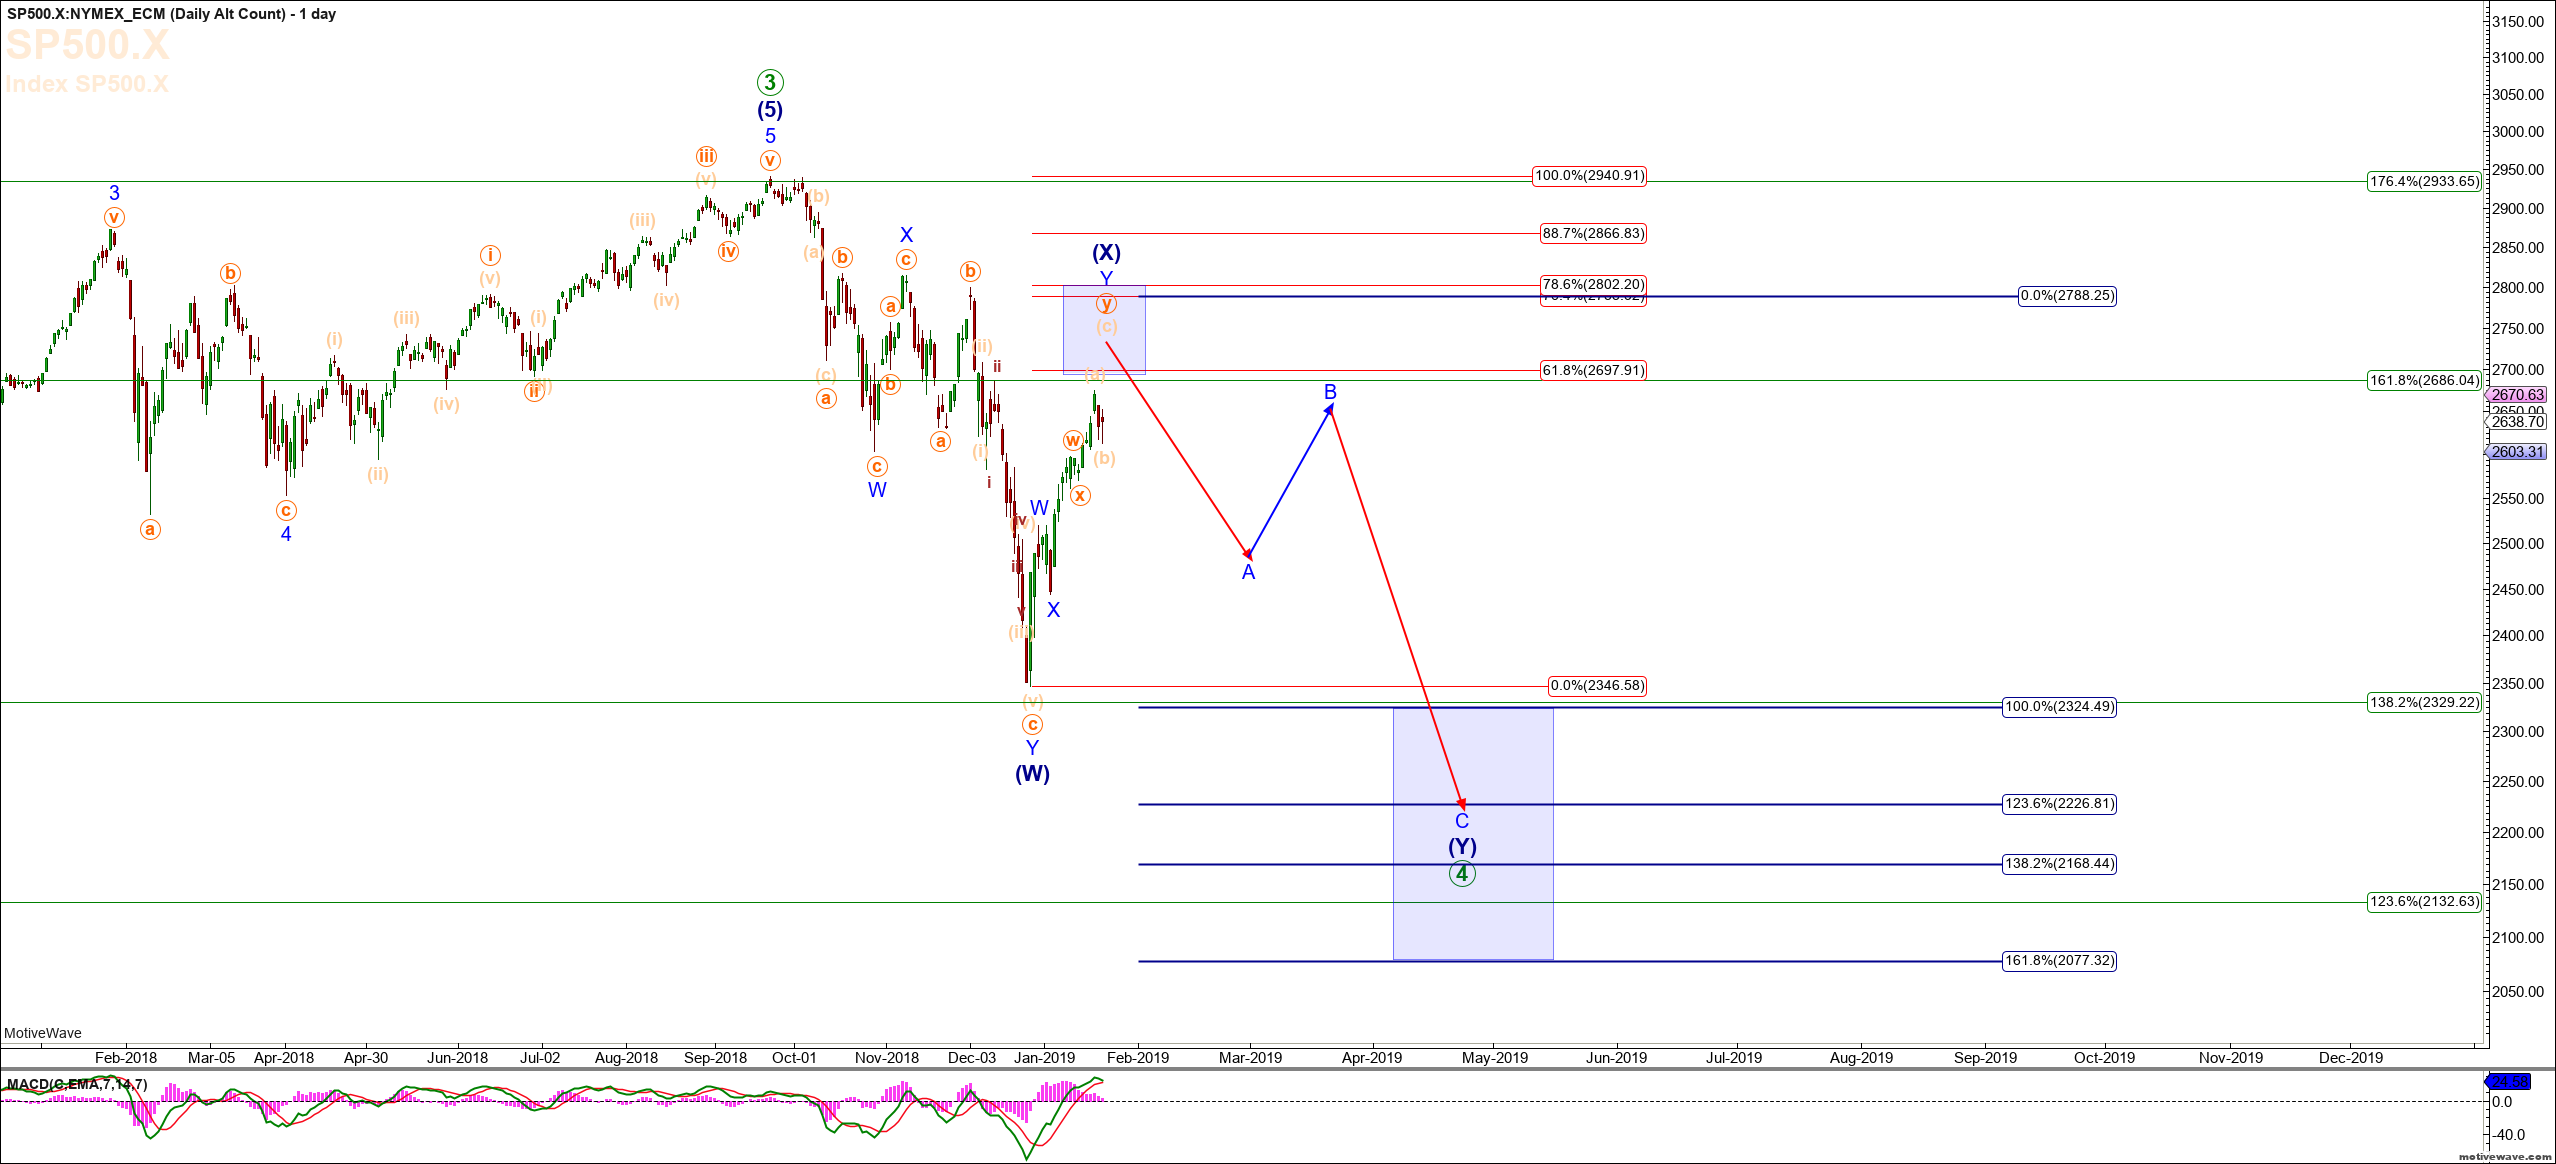
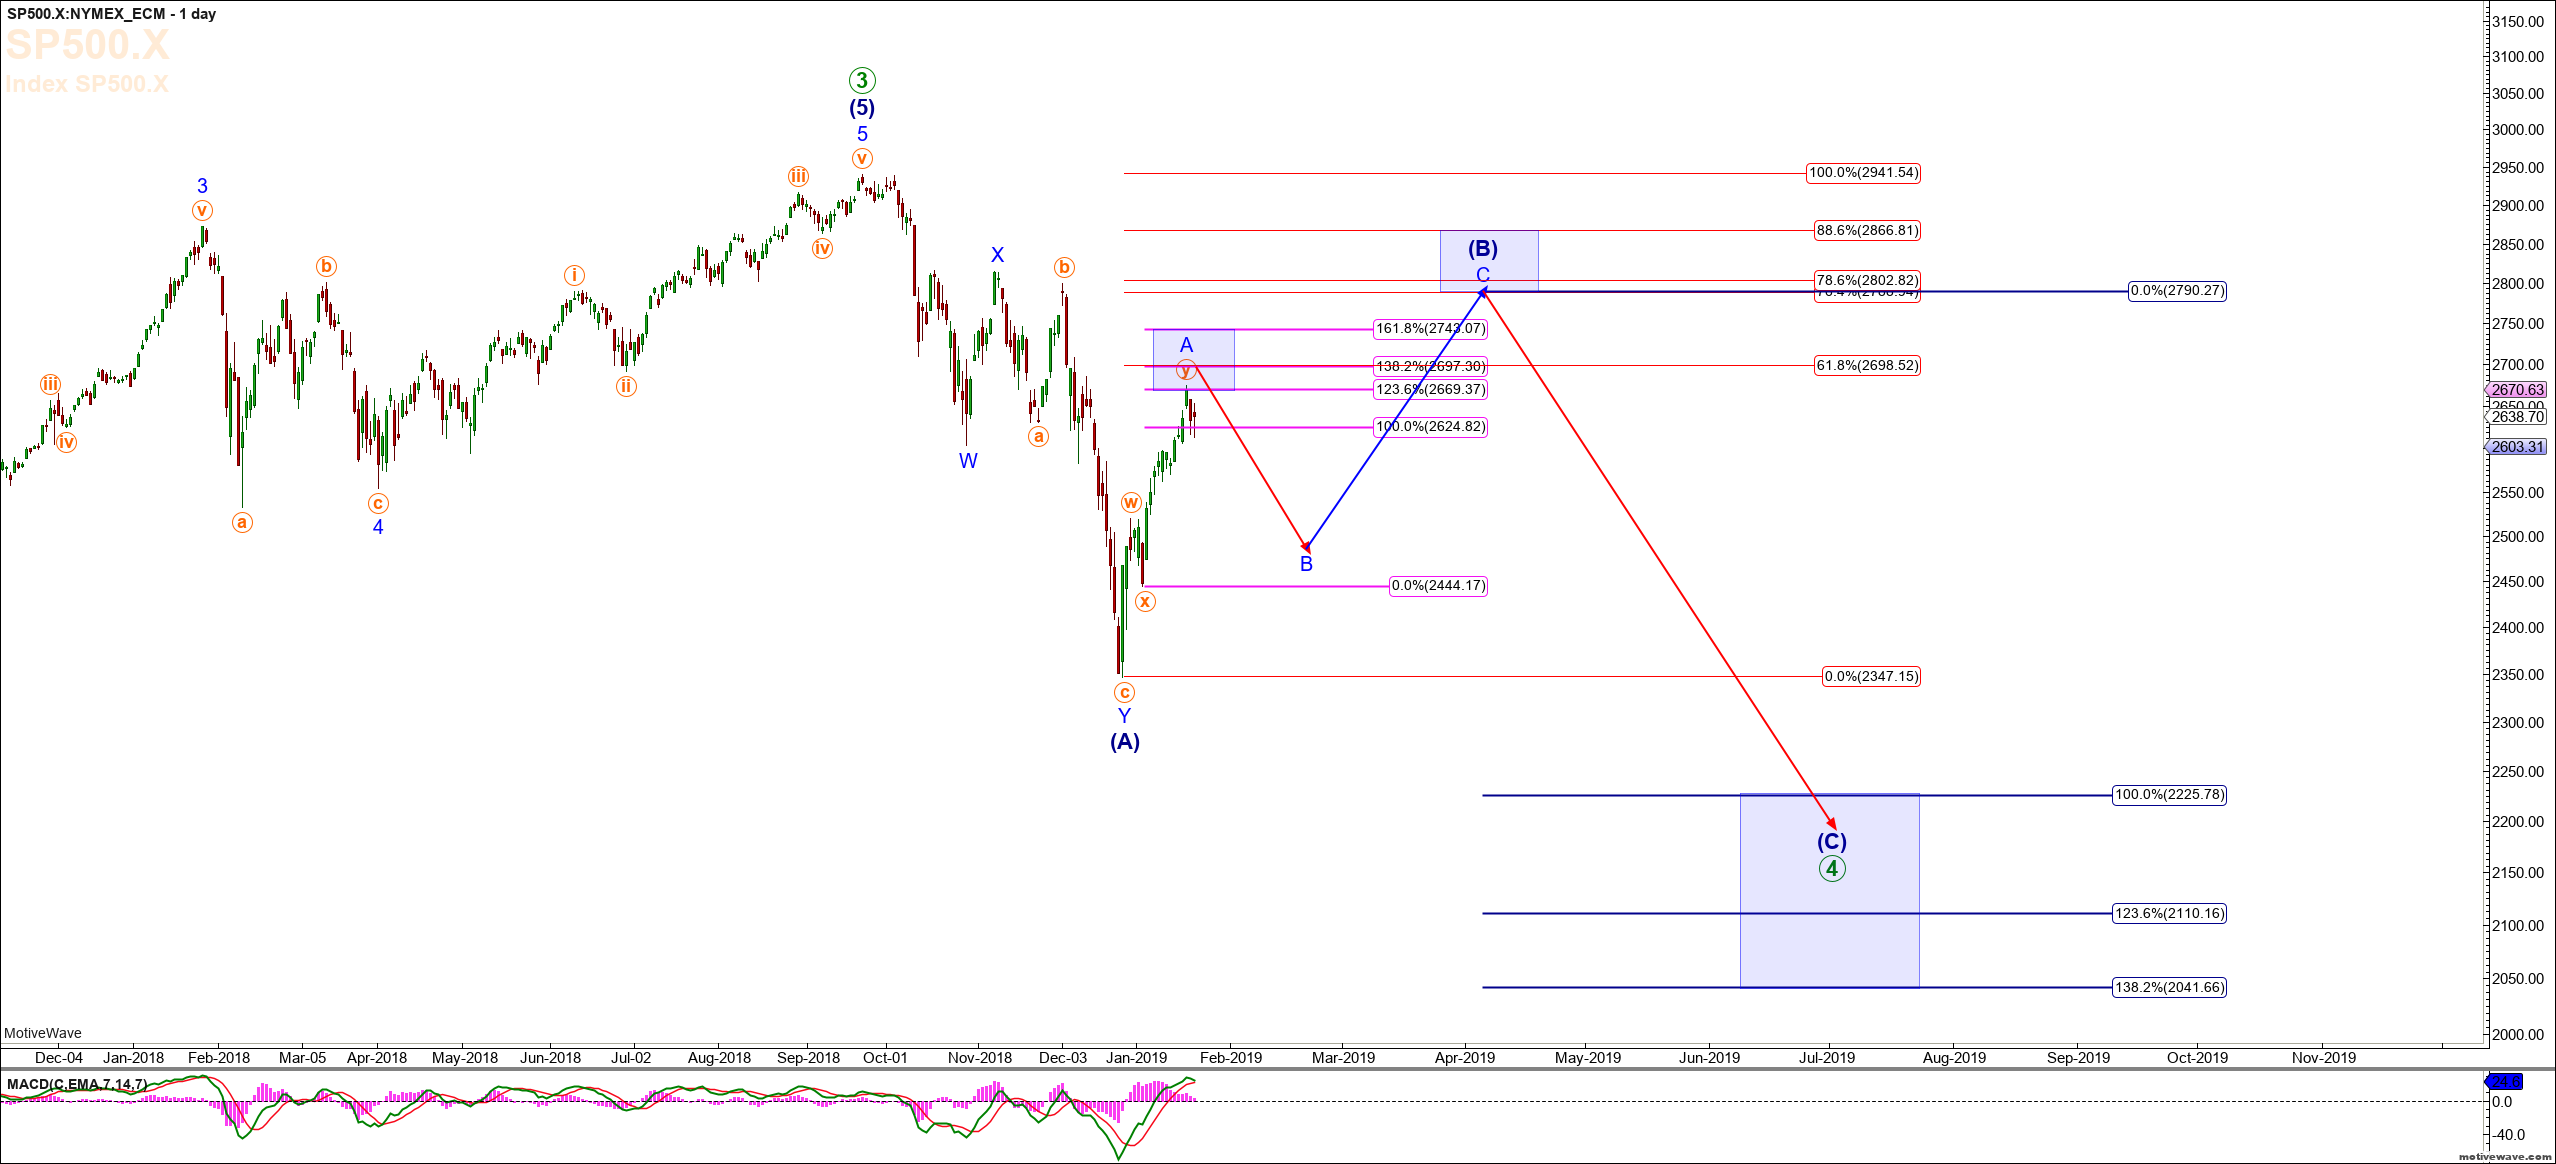
Our immediate expectation is that so long as SPX remains over 2,570 at all times, then all of the move up - as shown on both the Daily chart and the Daily Alt. chart - will conclude in the 2,731-2,743 regions, with a possibility it concludes in the 2,697-region. For investors taking intermediate positions long in sector ETFs, or futures traders, this is an excellent place to exit long positions. Alternatively, if SPX breaks below 2,570, we'll be looking for a retracement against the move down as an opportunity to exit longs and potentially short the SPX.
Monthly S&P 500 Chart
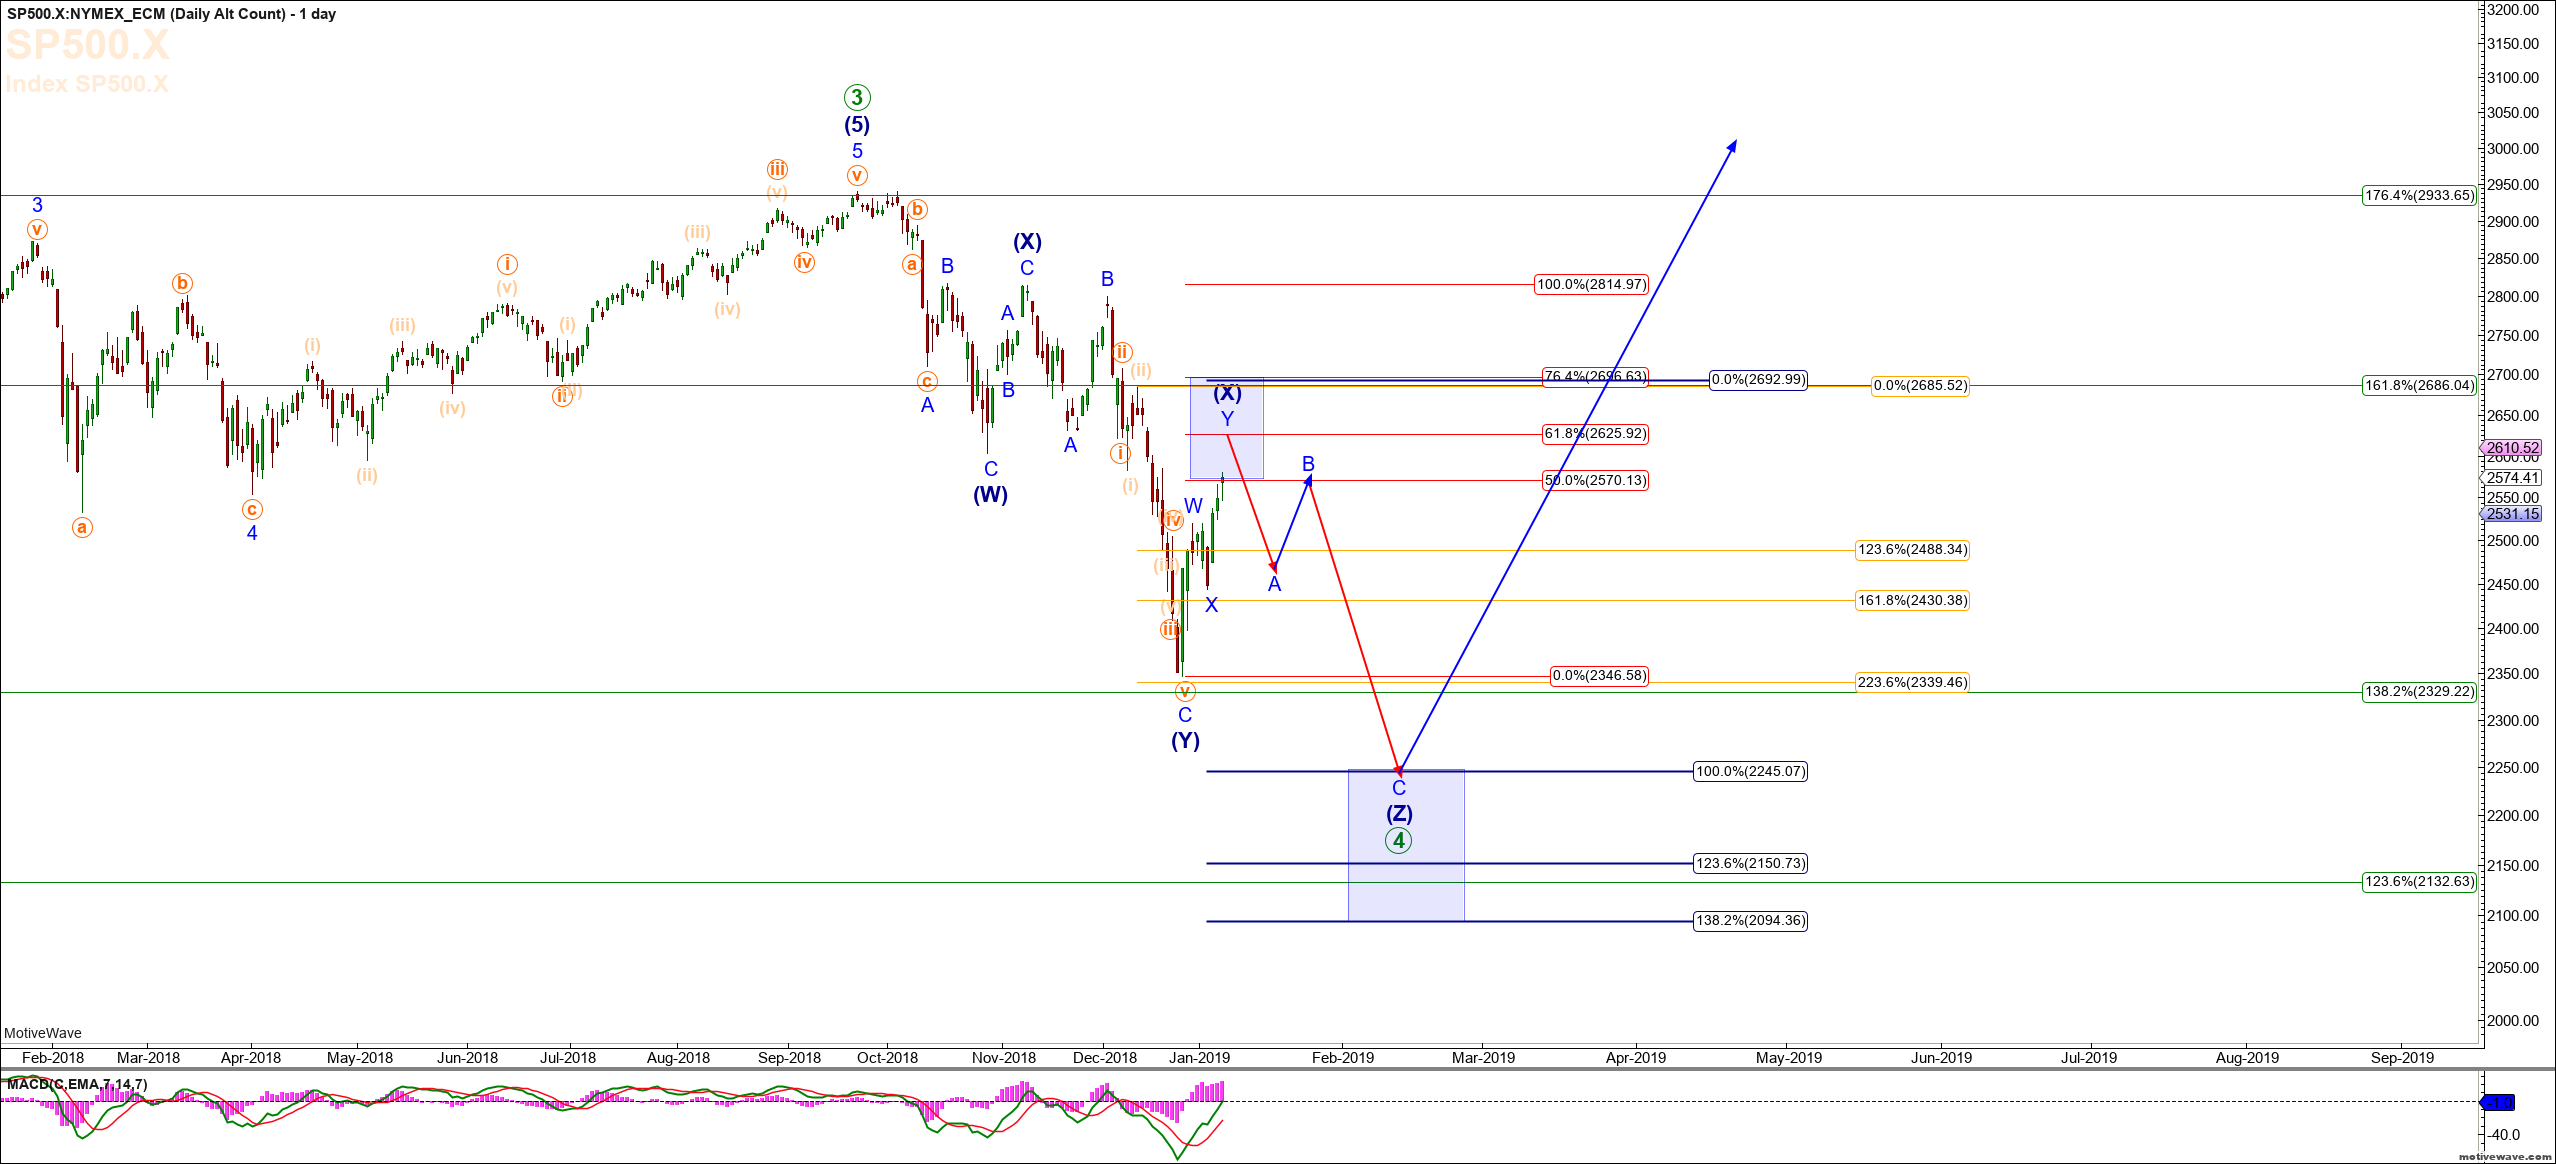
The question then arises as to whether the move up off the pre-Christmas low is an A-wave of a much larger B, as shown on the Daily Alt. Chart, or is all of a larger X structure, as shown on the Daily chart. While the determination of which count won't be known until we're better able to observe the downside structure, what is reasonable to assume is that for a period of time the index level for both the Daily and Alt counts are setting up for lower levels. The Daily Alt count suggests a move down into the low 2,400-region (2,430 to be precise), to be followed by a C-wave up towards 2,800, and then a massive move to our lower target region. Whereas the Daily count will provide a direct move to 2,245-2,094. This is one of those scenarios we as active investors seek to find, where the two most likely alternatives are pointing in the same direction.
Once we can confirm a short-term high is in place in the SPX and observe the downside structure, we'll be in a better position to "probability weight" which count is more likely. From the standpoint of overall time, the Daily Alt count is preferable, as it will gobble up significantly more time throughout the first half of 2019 and resemble more closely what one would expect of a 4th wave of this magnitude. As we're able to determine the downside structure, it may setup a fantastic long opportunity from the 2,400-region up to the 2,800-region, offering up the potential for an intermediate 17% non-leveraged return, followed by an even more fantastic intermediate short.
In conclusion, it's very likely the downside in the SPX is not over, but the path to lower levels could prove difficult for active investors and traders. Taking profits and looking for reasonable areas of support to re-enter long or short positions can offer tremendous returns. Simply holding out and going along for the ride is not an approach to realizing gains through a 4th wave of this magnitude. Cash is a position too, and exiting at key points and awaiting lower levels to take long-term positions should be the course for most long-term investors.