| Posted by Brian Fletcher on 24/01/2019 | 0 Comments |
Be patient and await the "right" entry in the precious metals miners sector.
Gold and the HUI Gold BUGS Index likely to see lower into mid-2019.
Protect your capital and limit loss of emotional currency by entering correctly into this sector.
The miners sector is setting up for extreme upside, but for those looking for an entry, patience is the key. In this article I’ll provide an update to the larger monthly view for gold and the HUI Gold BUGS Index, along with entry levels and timing for those seeking to take advantage.
Before getting into the meat and potatoes of the count, allow me to editorialize for a moment. With the possible exception of cryptocurrencies, I’ve seen very few investment sectors attract the extremes of investor and crowd emotions more than the precious metals mining sector. One of the many lessons long experience has taught me is that when emotions run high, investors make mistakes. It’s easy to see how this happens, after all in the first 7-months of 2016 the HUI Gold BUGS Index rallied from 99.80 to over 286 for a whopping 2.87x increase in value, creating the proverbial “fear of missing out” syndrome with many of those who failed to catch this enormous move. Following this move up, of course, was countless analysts who took full advantage to sensationalize the sector while attracting large audiences to their services by espousing premature entries, leaving their followers paying a very dear price.
The simple truth is that correction action is nothing short of very difficult, where corrections can exhibit as many as 13 different wave structures, leaving those who are experts in the field of Elliott Wave Analysis constantly using clues to determine what corrective structure is actually taking place, while at the same time seeking in good faith to provide investors who follow their analysis opportunities to enter for the next phase of the move up. As time goes on, and as corrective action continues, more and more clues are brought into the mix allowing one to begin to exclude certain structures and narrow the outcomes. Unfortunately, by the time this process ultimately plays out, investors who track along and take real money positions in sectors like precious metals miners have not only grown weary awaiting the elusive move up, but many have taken huge drawdowns in their capital. Of course, this process is exacerbated by the flurry of fundamental analysts who get on board near the highs as well, drawing investors into the sector at precisely the wrong time. By the time the entry is at hand, most who were initially focused on taking entries have experienced such enormous losses that they’ve mentally discounted the sector forever, resulting in failure to participate when a meaningful move to the upside finally does occur.
What we’ve found works well is to identify key areas of support, then buy those levels of support and exercise extreme risk management on those positions until they’re firmly in the black. This allows us to enter breakeven stops quickly, and observe the price action that occurs off the support in order to determine if it’s corrective or impulsive. An example of impulsive price action would be a smaller wave pattern version of what occurred to the price in the VanEck Vectors Gold Miners ETF (NYSEARCA:GDX) in the first 7 months of 2016. If the bounce off support fails to provide a proper upside reaction, we exit, or retain the position until it stops out at breakeven, then rinse and repeat the process until we get our entry. There is nothing that convinces an investor to NOT participate in a sector more than taking losses. Taking losses effects emotions, and emotions effect decisions, and in particular decisions to exclude that thing that caused the negative emotion to begin with - a loss. In the case of miners, it’s our view to be patient, don’t get caught up in the hustle and bustle of crowd sentiment, and don’t suffer from the fear of missing out syndrome, and above all else, don’t expose capital to scenarios where the losses could affect your emotions.
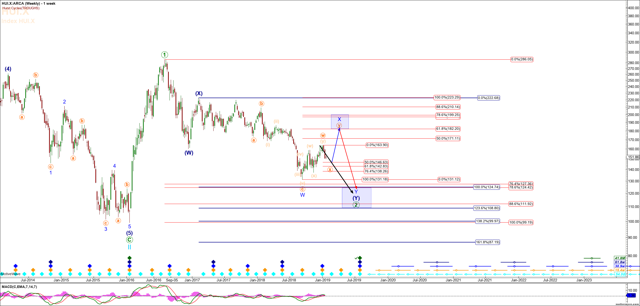
Now, let’s take a look at the counts and opportunities for entry into the miners sector. I’ll start with the Weekly HUI Gold BUGS Index, see chart below. The move up that occurred off the January 2016 low was clearly impulsive. This means that after a correction occurs, the next move up will be either a C-wave, which would target 1.0 – 1.382 x the size of the A wave off the retracement low - what we have labeled on this chart as green 1, or would extend to the 1.618 – 2.0 x the size of wave 1. While I don’t have the upside targets posted on this particular chart, you can reference them in previous articles I’ve written, but suffice to say that in either instance it’s an enormous move up. Hurst Timing indicators, as represented by the color coded diamonds at the bottom of this chart, suggest a low will occur in the sector in mid-2019, around the July timeframe. Since this is a complex WXY corrective pattern, the X wave can be complete, or even with a slightly higher high, then a direct move down into the lower target region, or what we think is even more probable is another small wxy is occurring before the capitulation occurs into mid-2019. In either instance, another low seems most probable. The alternative would be that the entire move up is forming a leading diagonal, which would fetch a very deep retrace. Since the pattern structure is more akin to a movie vs. a picture, as the pattern unfolds we’ll be in a better position to determine which is more likely, but at this moment given that our Hurst work suggests a low into the July time frame we’re expecting one of two potentials as exhibited on this HUI Weekly chart.
There are a few miners in our strategic miner’s portfolio that may have found a low, in which case we’ll be taking long positions in these at their respective support levels on the next pullback, but will likely exit with profits, or out at breakeven stops, as most of the individual miners are suggesting lower to come.
HUI Gold BUGS Index
The gold chart seems simpler than that of miners. A simple 3-wave abc move down in gold to the target of 1109 – 1078 to conclude the Y wave of the correction seems most probable. In the event that the HUI Gold BUGS Index is able to complete the downside pattern coincident to gold holding over the August 2018 low, then we would view gold as having completed a larger B-wave triangle, adding further evidence to the notion that the next move up into the 1665 – 1795 region will be terminal. In other words this will be all we get in gold before then heading to new lows below those established in 2015.
Gold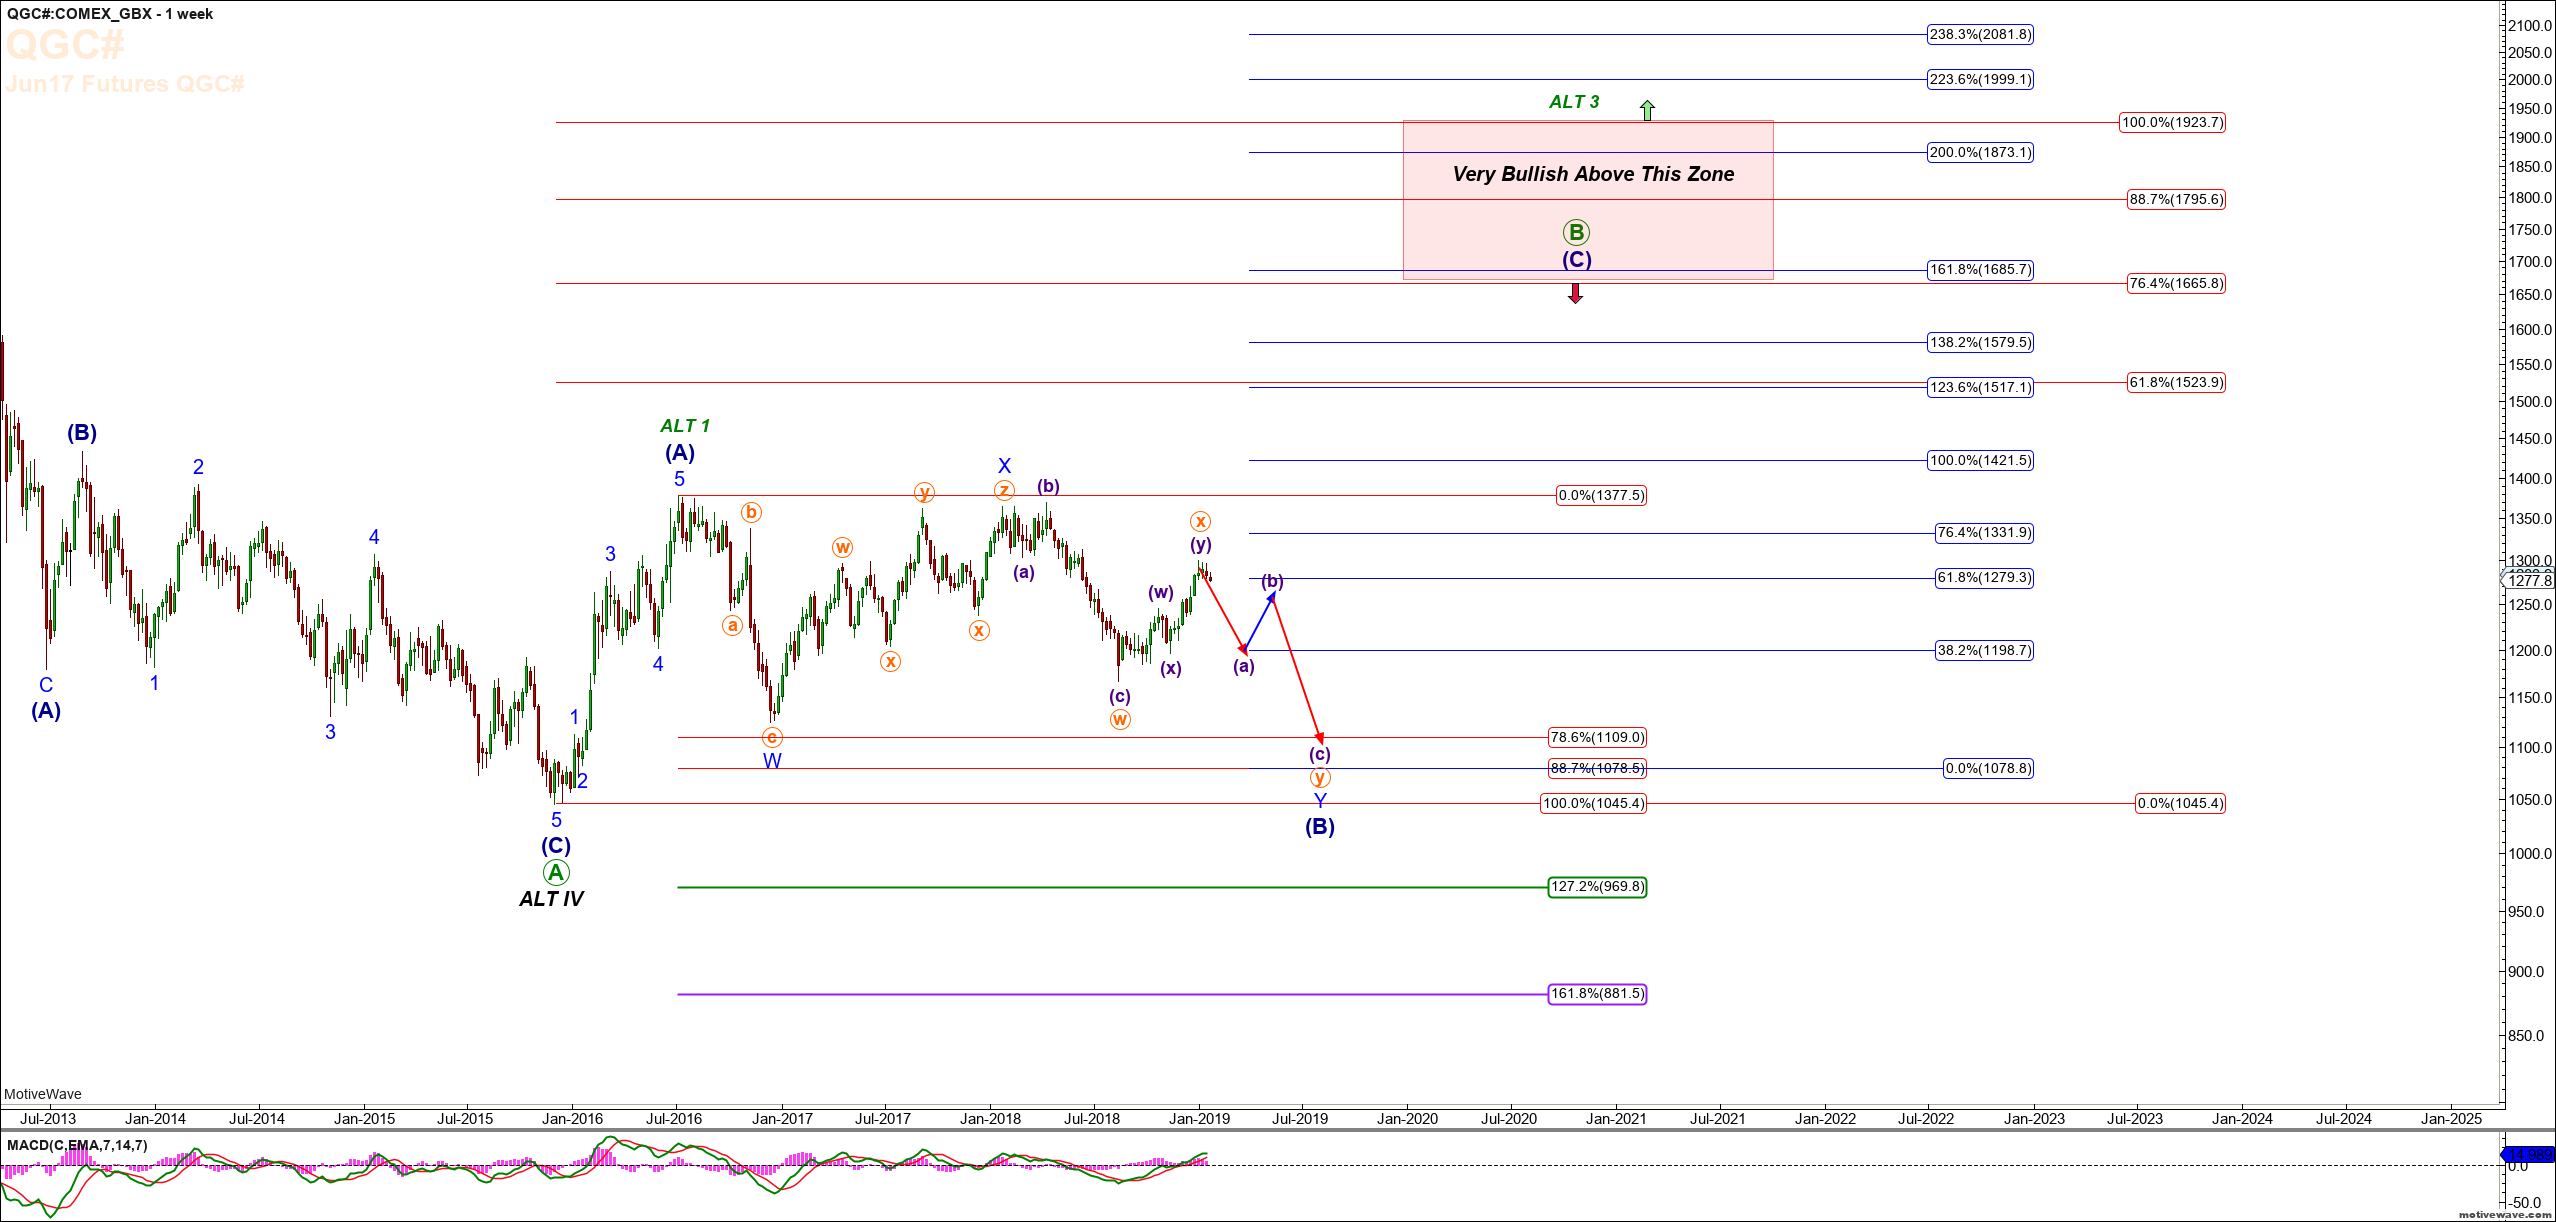
In conclusion, precious metals miners offer extreme upside potential for those who are patient and don’t rush early to the party before it begins. It’s imperative to retain one’s emotional currency by not taking huge capital drawdowns in order to have plenty of both when the time comes to jump in with both feet. Entering too quickly based on the fear of missing out may come at a cost, so understand that cost before pulling the trigger to go long.