| Posted by Brian Fletcher on 30/01/2019 | 0 Comments |

There are many miners to choose from, but forming a portfolio comprised of miners with the strongest fundamentals affords the most upside.
McEwen Mining, Inc., CEO Rob McEwen is a known quantity who has plenty of his own skin in the game, and who only benefits when MUX shares perform.
MUX offers two scenarios - Bullish and Very Bullish, both sharing the same entry price level.
Prepare your portfolio list now, and have a plan on how you intend to take advantage of this sector opportunity.
It's not often you can enter a long position in a stock where the bullish upside overlaps what could also be VERY BULLISH upside, but this is exactly what is happening in the miners sector. There is no lack of miners for investors to choose from worldwide, but as I've discussed many times, the sector members vary widely in the disparities relating to their respective fundamentals. We have completed a thorough fundamental analysis of the candidates and narrowed our buy list down to 20 of the VERY BEST miners, and are focusing on these for our subscribers and investors. One miner on our short list is McEwen Mining, Inc. (NYSE:MUX). The intent of this summary is to look at price targets, not fundamentals for MUX, but no mention of McEwen Mining can hardly be made without mention of its namesake, Rob McEwen. In the 1990's Mr. McEwen consolidated 8 companies to form Goldcorp (NYSE:GG), then grew this company to over an $8B market cap company, and of course it is now merging with Newmont Mining Corporation (NYSE:NEM) to become one of the largest gold producers in the world. Presently, Mr. McEwen owns 23% of MUX, having invested $161M of his own capital, has a salary of $1.00 per year, and accepts no bonus or company options. Suffice to say, anyone who thinks that management or fundamentals don't matter may want to reconsider this notion.
In previous articles I discussed how the precious metals mining sector is setting up for an enormous push up, with our expectations that a low will be established late spring to early summer, 2019. In my most recent article I showed our expectations for the HUI Gold BUGS Index, whereby we are expecting another low in one of two paths. Following this low, we are expecting either a C-wave, similar in size or slightly larger than the A-wave that occurred in 2016, or alternatively a very robust 3rd wave that would take out the 2011 high in the complex. While we are expecting another low in the entire metals and miner's complex, we'll be watching the smaller time frame patterns closely on the next pullback to substantiate this thesis vs. the possibility of a retracement against the most recent rise off the September, 2018 low.
HUI Gold BUGS Index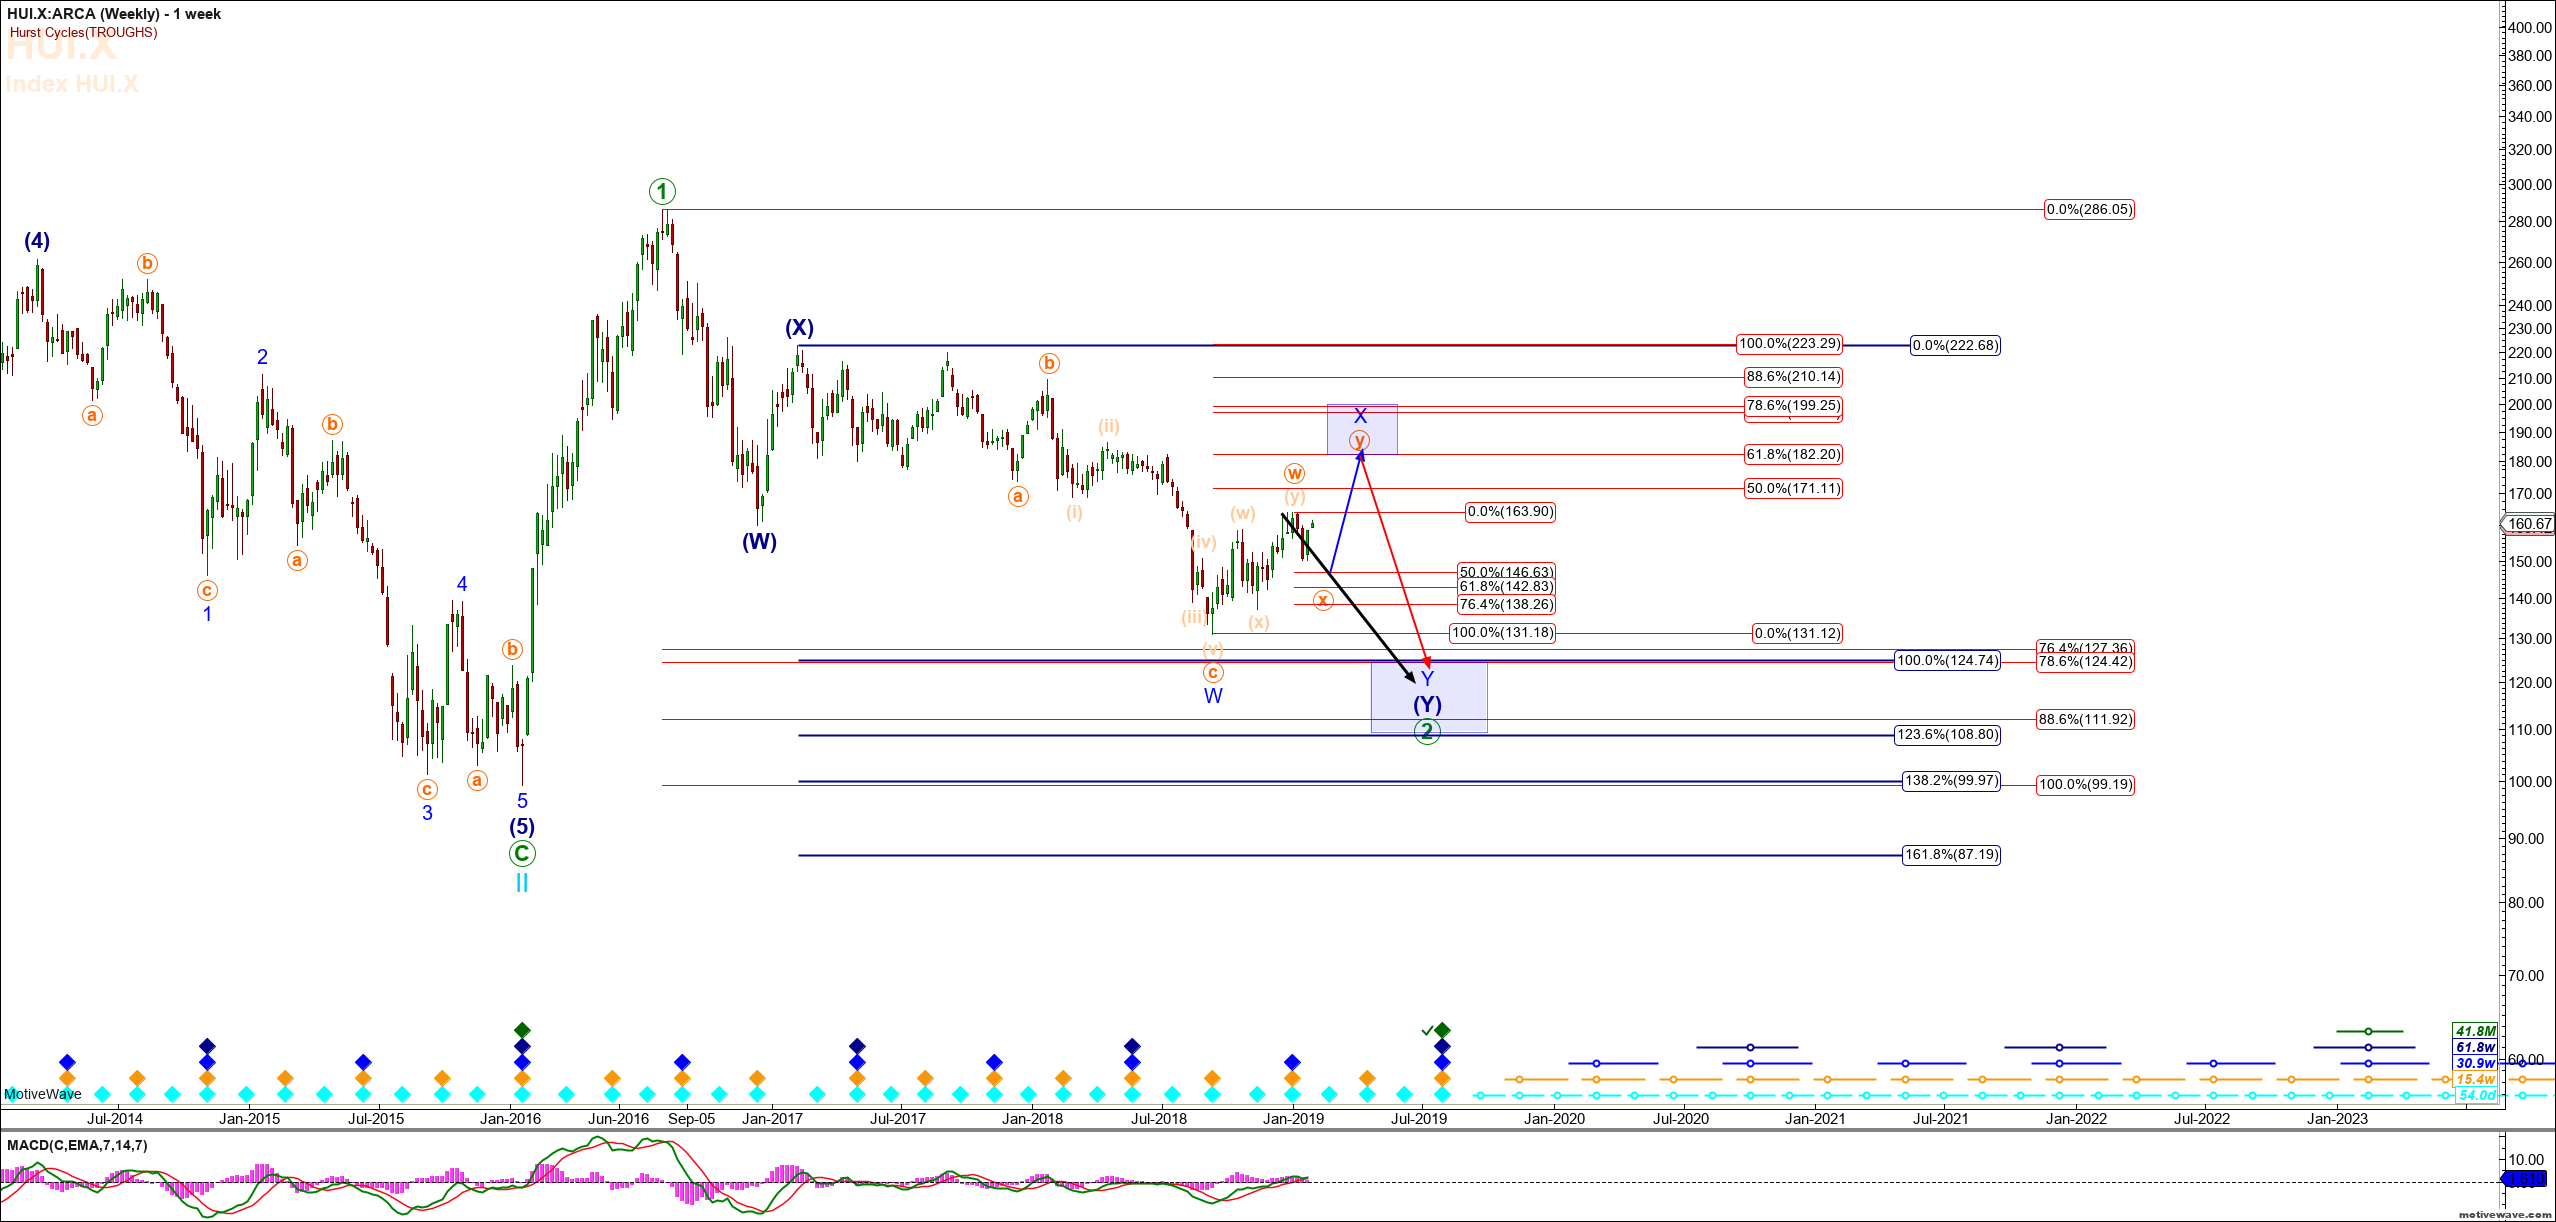
Many of the miners in our Strategic Miners Portfolio support our larger picture perspective, including the Elliott Wave count for MUX. Like the HUI Gold BUGS Index, MUX provides two upside potentials, as I'll describe in more detail below.
MUX initially rallied from its October 2000 low of $.10 per share forming a large impulsive move up in October 2006 to $10.31, for a 103 fold increase, for what we are viewing as an (A) wave, where the extremes exhibited in price fluctuations off the 2006 peak are forming a multi-year triangle. Triangles are virtually only seen as part of a B-wave or 4th wave, this clearly being the former. Triangles are comprised of a series of 3 wave moves (A) (B) (C) vs. impulsive 5 wave moves, forming what is typically 5 price points at their respective peaks and valleys before breaking out of the triangle. MUX is adhering in picture perfect fashion to the formation of a very large triangle.
Presently, MUX is completing either all of the E-wave (Very Bullish), or is completing only the (B) of the D-wave of the triangle (Bullish). See chart patterns for both counts below. In the case of the bullish count, as shown on the chart below (Bullish Count), an entry into MUX in the $1.00 - $1.45 region would fetch a move up to the $7.88 - $8.95 region, for a 5 - 8 fold increase if share price. Not bad!
Very Bullish Elliott Wave Triangle Count - MUX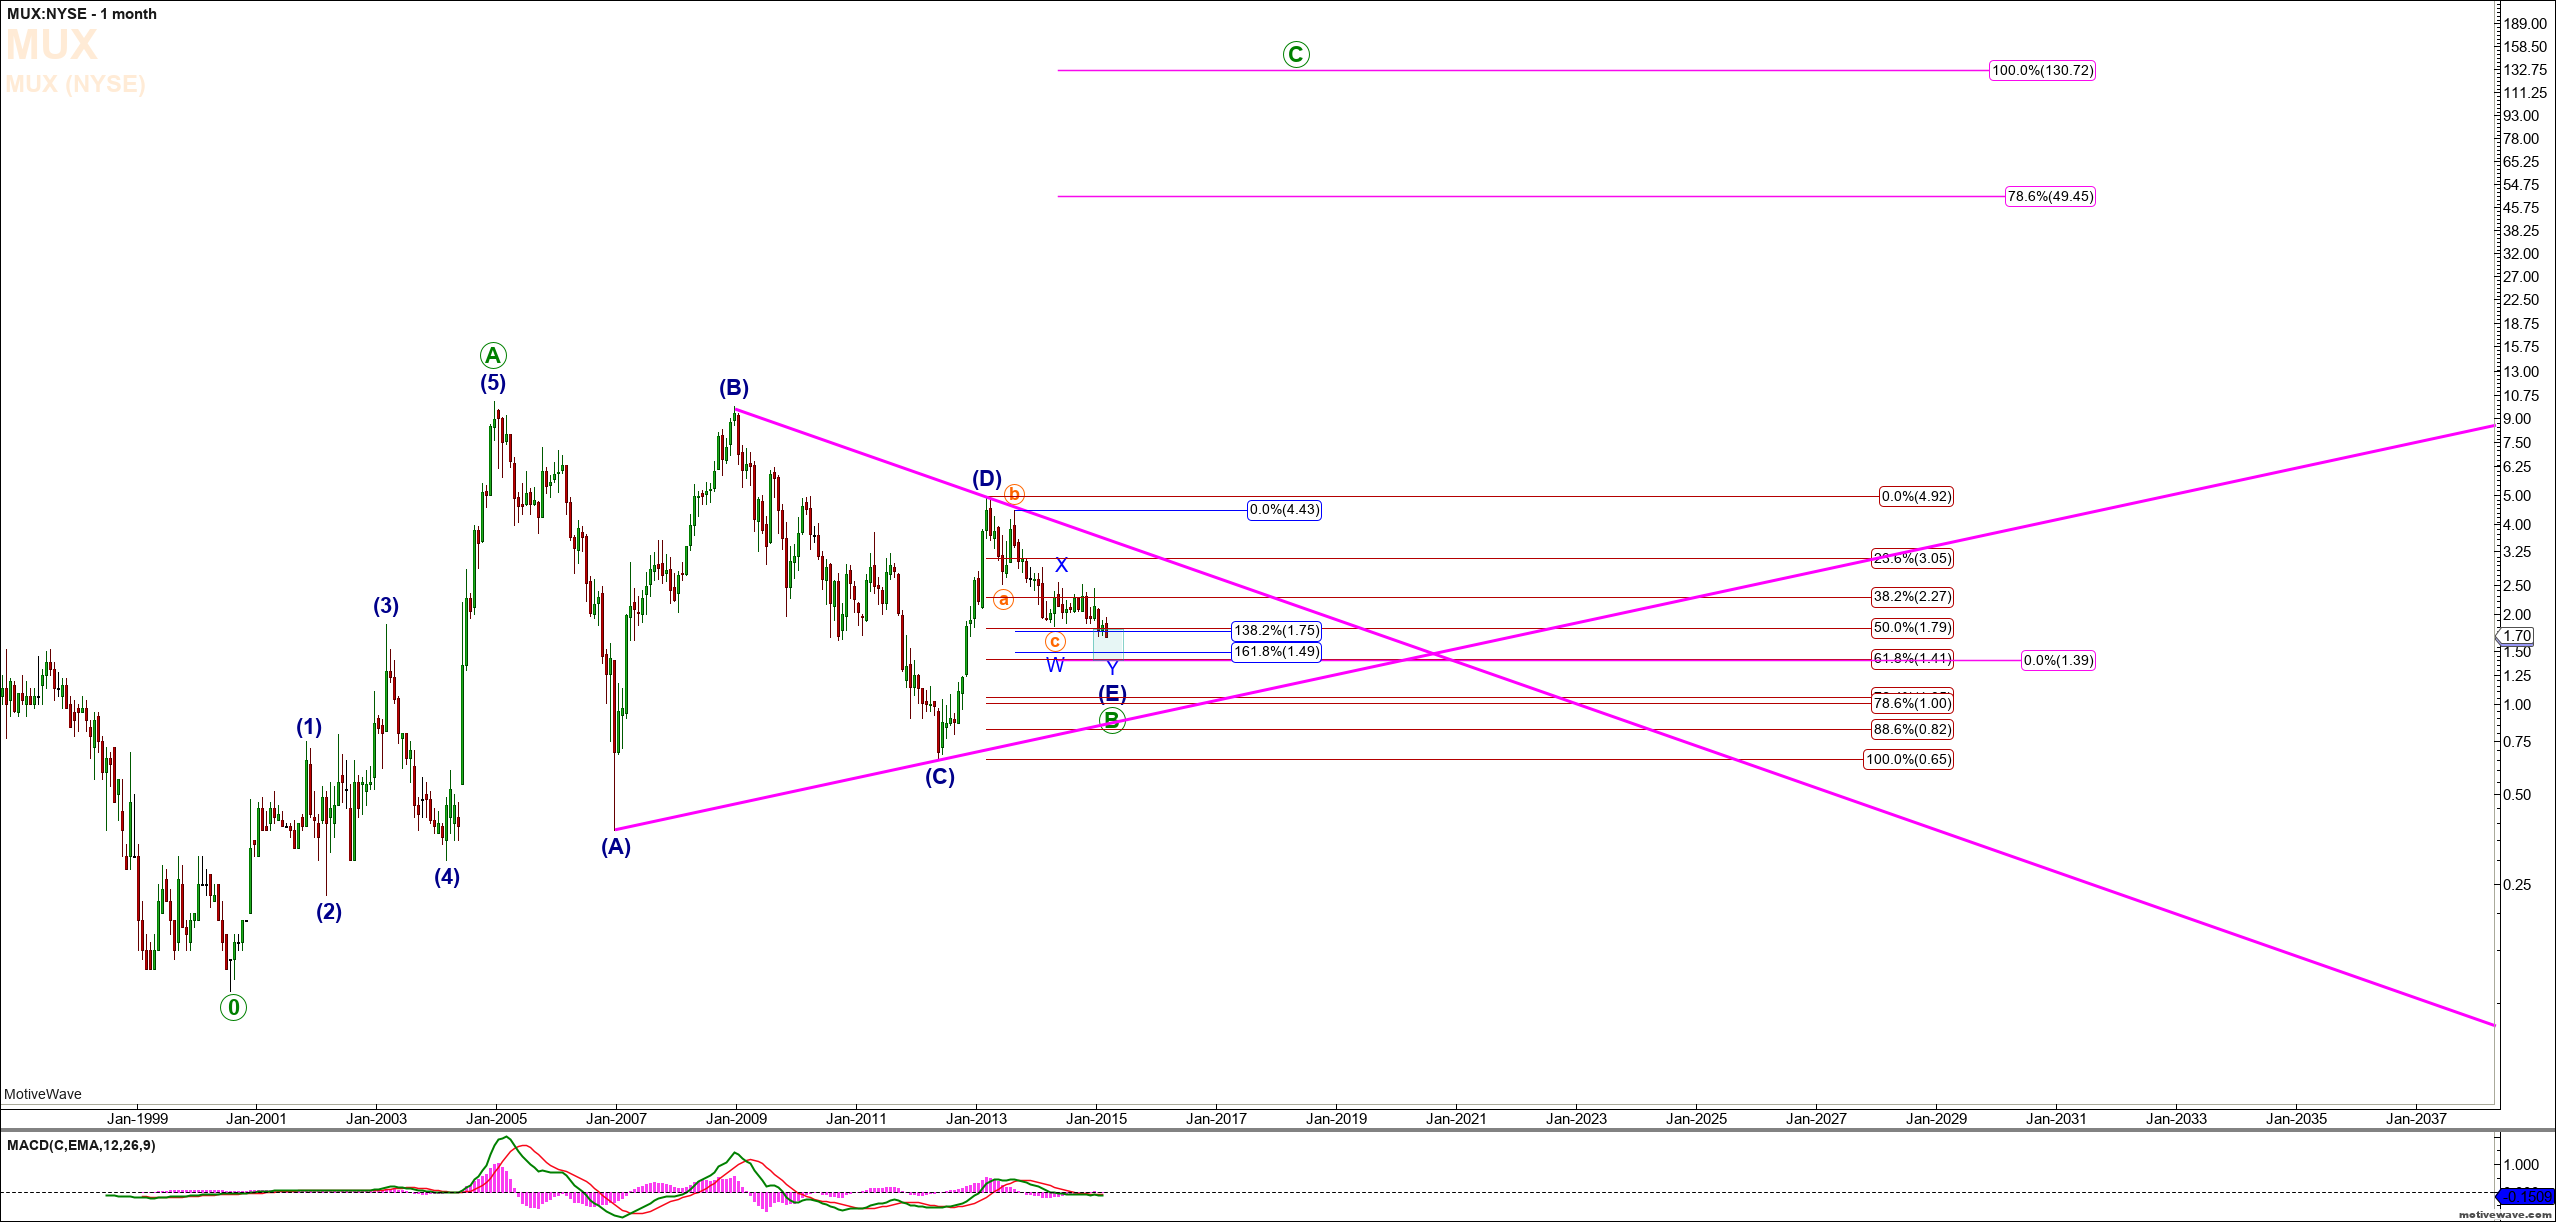
However, in the Very Bullish scenario, MUX would break through upside resistance and take out the 2011 high and ultimately heading to a price target of $130 or greater. Keep in mind that while this seems extreme, on volatile instruments with long time frames, log scale fibs are the preferred method for determining price targets. My thanks to Michael Richards with www.timepriceanalysis.com for preparing the log scale fib targets for MUX in the Very Bullish perspective.
For many investors, an entry at $1.45 is just fine. However, keep in mind that the difference between entering at $1.45 vs. $1.00 per share is 31% difference. We will be acutely focused on the smaller time frames as MUX commences its next drop to ensure getting our subscribers and investors in as near the low as possible.
Bullish Elliott Wave Triangle Count - MUX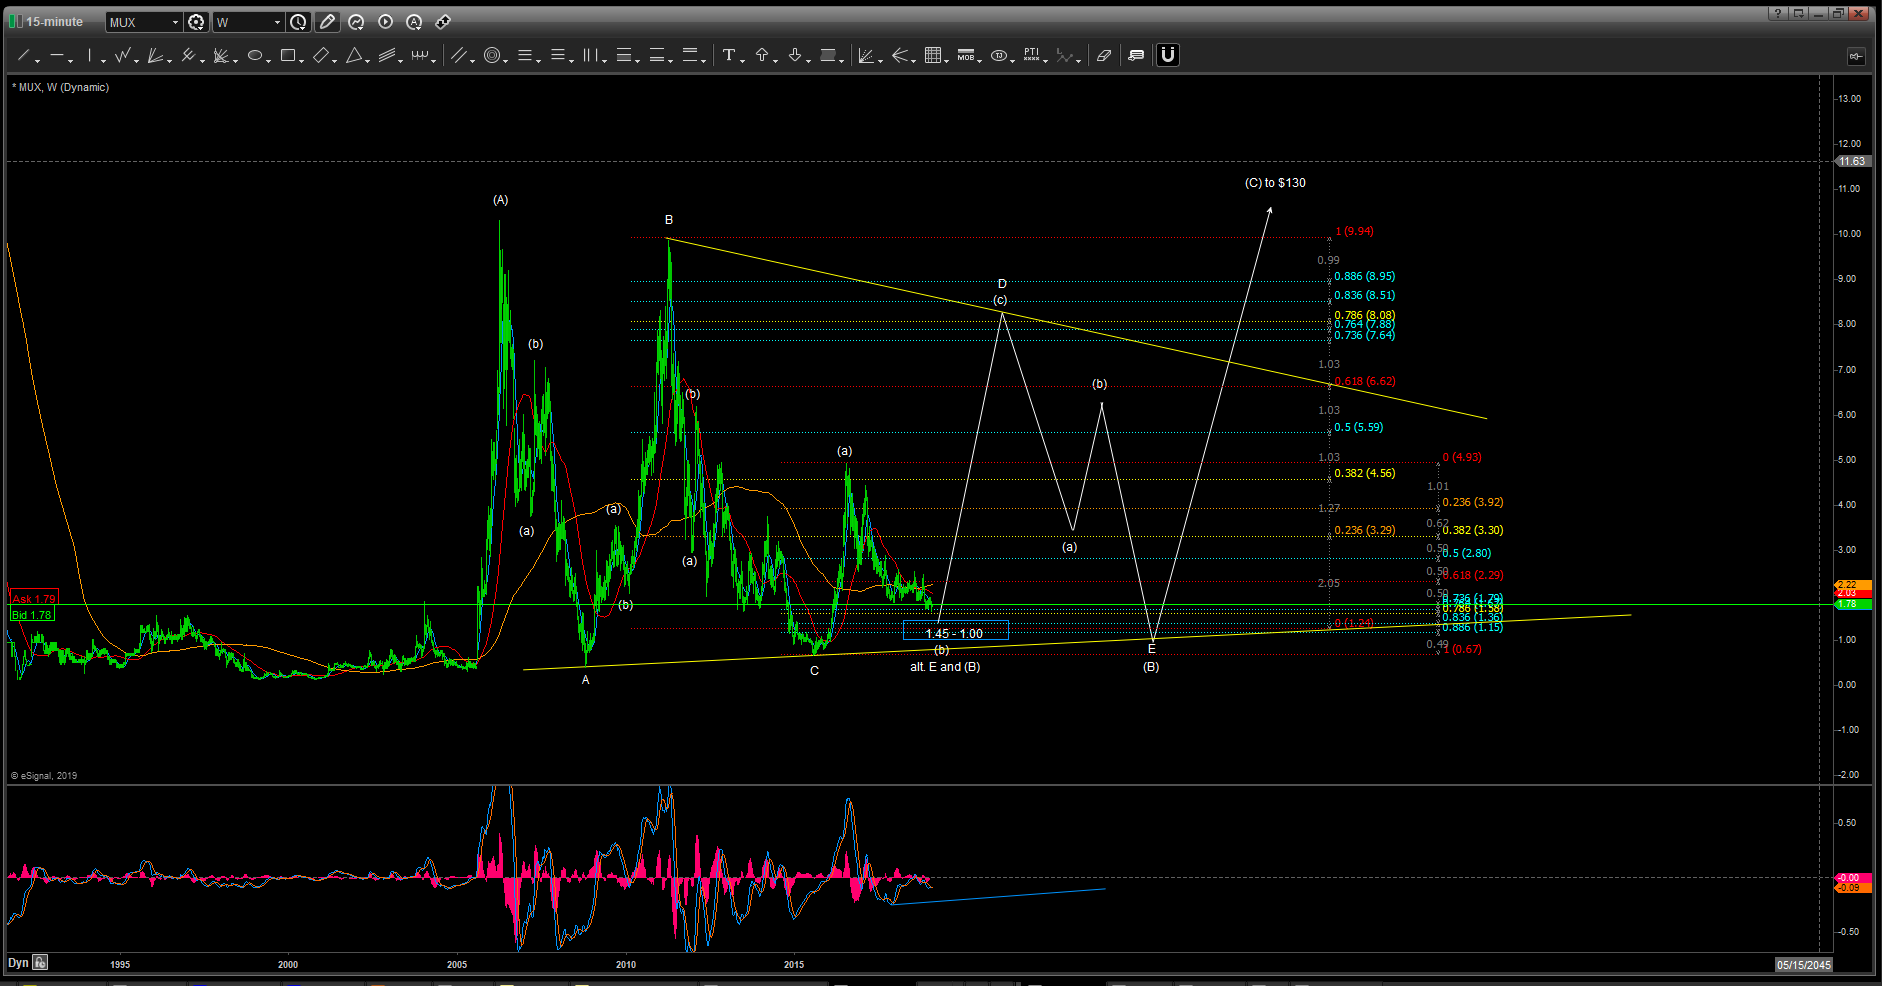
Concluding Remarks
McEwen Mining is a well-managed company with management that has a proven track record for delivering to shareholders. Management does matter a great deal, and for anyone who fails to understand this, look at not only Mr. McEwen's previous accomplishments, but also take a look at the last 10-year chart for Australian miner Northern Star Resources (OTCPK:NESRF), who has managed the grow share price in a declining metals environment.
The precious metals mining sector is setting up huge upside. Having a select portfolio of the BEST miners coupled with the correct entry as a core position will allow investors to capitalize on the huge move up. MUX should be one of the companies on your short list. While MUX may be providing a 6-8 fold opportunity, it could also be setting up for a 100 fold increase. Buying opportunities like MUX, where two Elliott Wave counts overlap in the same direction is the best of all worlds.