| Posted by Brian Fletcher on 30/01/2019 | 0 Comments |
Crude Oil setting up a 45% - 65% upside non-leveraged trade.
When two Elliott Wave counts both project in the same direction for a significant amount of price movement, it enhances the risk to reward skew dramatically in our favor.
It doesn't take too many of these types of investment opportunities each year to make a profound difference on achieving super performance.
You don’t need to use leverage to make significant returns each year. As I explained in my article about using leverage with precious metals miner, there is a definite place for it, but by no means is it necessary to achieve upper performance. Being selective and patient, and doing your homework ferrets out scenarios where the risk to reward skew is so much in your favor that leverage is not necessary, and only adds to your overall risk profile.
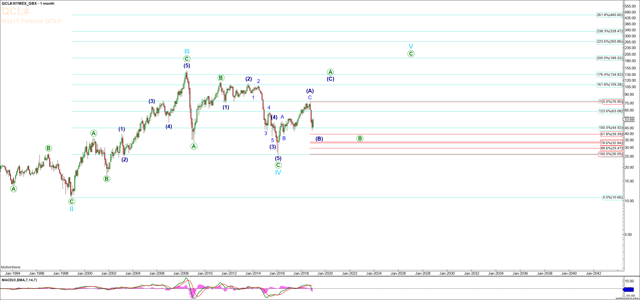
One such opportunity is setting up for a long trade in Crude Oil. Below is the monthly chart of crude which shows the bird-eye view of crude oil, and suggesting that it’s currently in or has already completed the blue B-wave. While the upside for the green A-wave is substantial, let’s bring it down to a smaller timeframe and take a look at the “tale of two counts” in order to quantify the low risk portion of the next move up.
Crude Oil Monthly Chart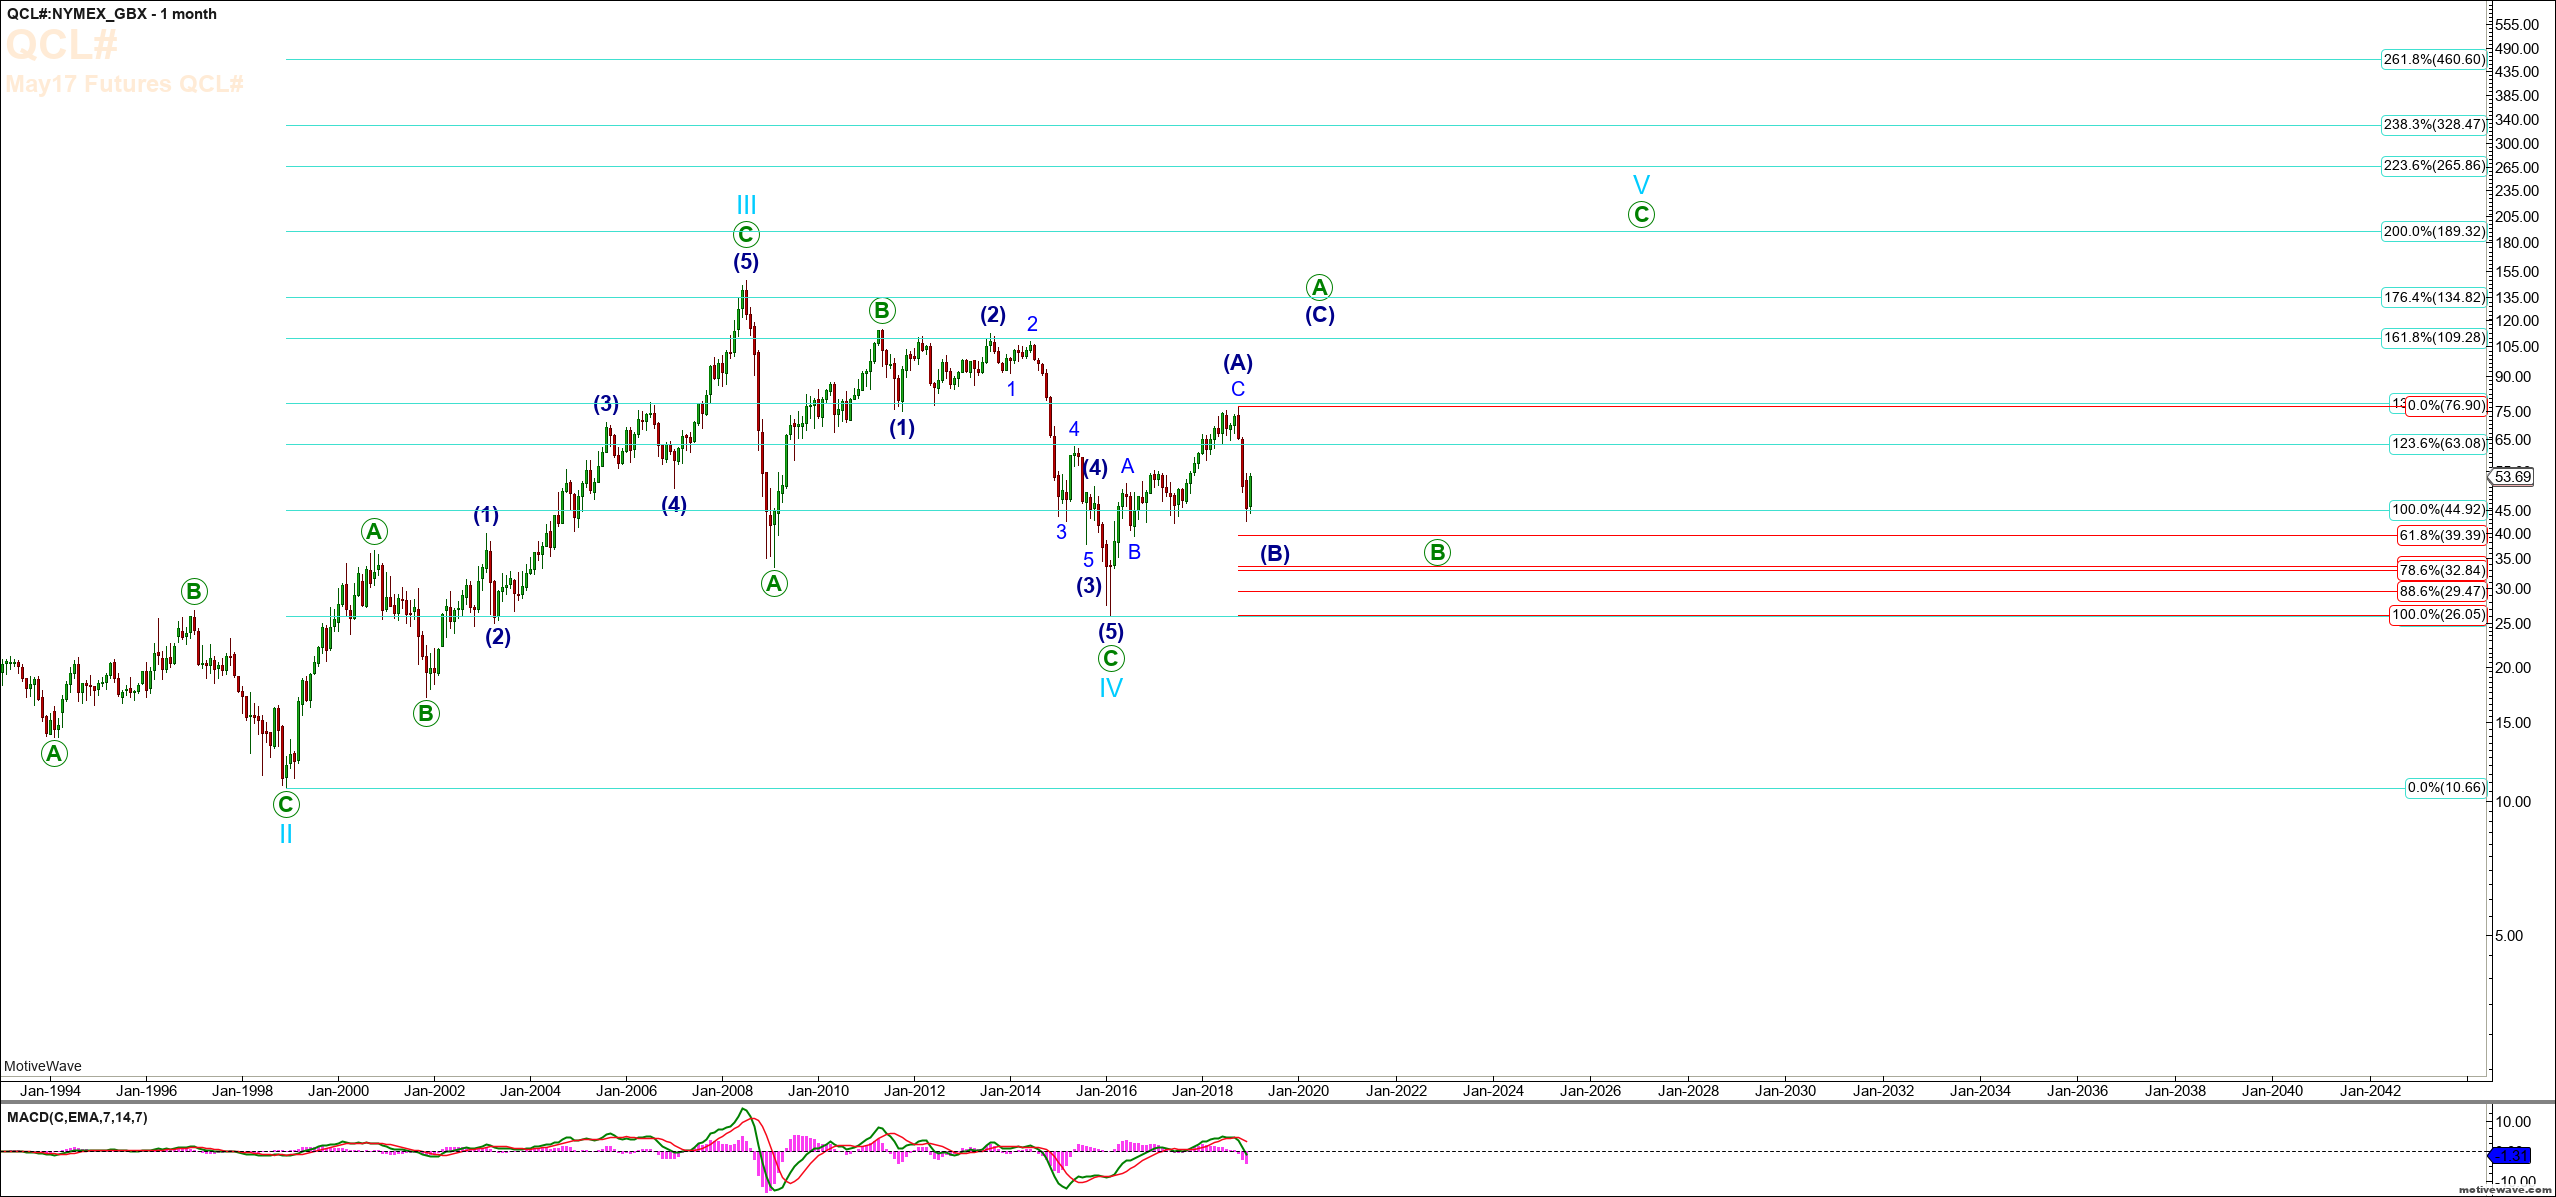
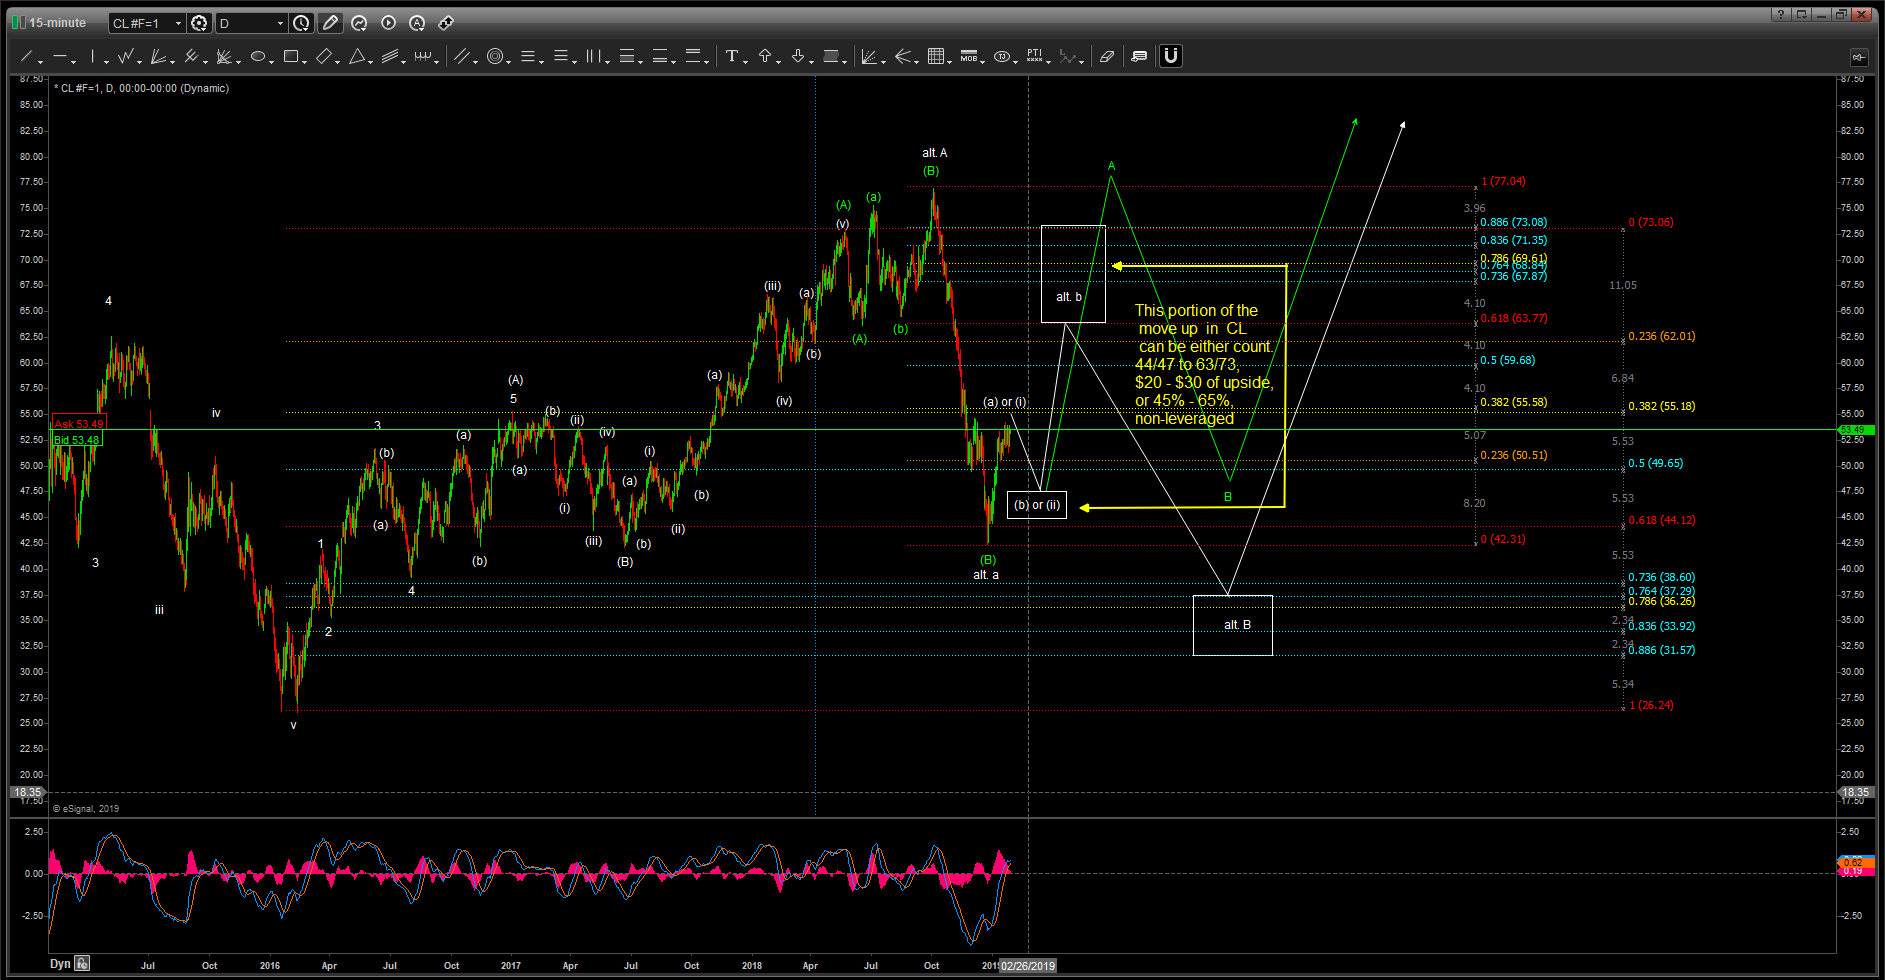
So, what we don’t know is if the blue B-wave has completed or not. If not, then the white count on the Daily chart below will result in a pull back to the $43 - $47 region, followed by a move up to the $63 - $73 region before exhibiting another massive decline to $37 - $31.
If the blue B-wave has completed, then the green count will be the active count, and will result with a pullback to the $43 - $47 region, followed by a move up to the $77 region, before exhibiting a corrective move against the entire move up off the December 2018 low.
For clarity, see the chart below entitled Crude Oil Daily Chart - showing the overlapping counts. The green line path represents one count we're tracking and the white line path represents the other. Note that for a period of approximately $20.00 of price movement, both paths are on the same course to the upside, and both counts originate from the same entry point.
So, as you can see, there is a portion of the upside price movement that both potentials share in common. As suggested on the Daily chart below, that portion of the move in common is from the $43/$47 region to the $63/$73 region. The overlap of these two Elliott Wave counts is the “high confidence” portion of the move up.
It is these types of scenarios that can have a huge impact on your annual performance. This scenario alone is offering investors the potential for a 45% - 65% return on capital with very little downside risk, and in a non-leveraged fashion.
Instruments you can use to take advantage of this move include USO (United States Oil Fund LP) as a non-leveraged ETF, or for a leveraged ETF approach UCO (ProShares Ultra Bloomberg Crude), or can use CL futures contracts.
Crude Oil Daily Chart - showing the overlapping counts
Concluding Remarks
Crude Oil is setting up two Elliott Wave counts that overlap for a period of price action. It’s the portion of price movement that the two counts share in common that is the low risk portion of the trade.
There are plenty great opportunities to be found that will supercharge performance with the risk to reward skew heavily in your favor. You don’t need many in a given year to realize super performance type returns.