| Posted by Brian Fletcher on 10/02/2019 | 0 Comments |
The S&P 500 came right into our target zone and reversed.
Investing is about being patient and preserving your capital to take advantage of high confidence opportunities.
Where the S&P 500 is going from here and how to position for outsized gains.
In my article on January 24, 2019, I said:
Our immediate expectation is that so long as SPX remains over 2,570 at all times, then all of the move up - as shown on both the Daily chart and the Daily Alt. chart - will conclude in the 2,731-2,743 regions, with a possibility it concludes in the 2,697-region. For investors taking intermediate positions long in sector ETFs, or futures traders, this is an excellent place to exit long positions.
Since this article was published two weeks ago the S&P 500 came up into our target box at 2,740 and is now reacting to the downside. So, what is next for the S&P 500?
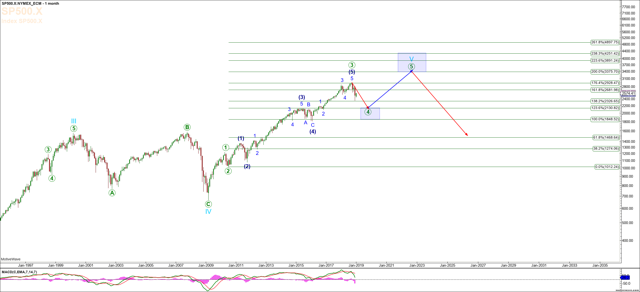
First, let’s go back to and review the Monthly S&P 500 Chart and get our bearings. The S&P appears to have completed its Primary Degree Wave 3 at the high seen in late September, 2018, and is now in a corrective structure to lower, with an ultimate price target of 2,357 – 2,187. The move down off the September, 2018 high is a clear WXY structure in best counts as an A-wave of Primary Degree Wave 4. Therefore, the SPX is now in a B-wave with an expectation of a C-wave to come.
Monthly S&P 500 Index Chart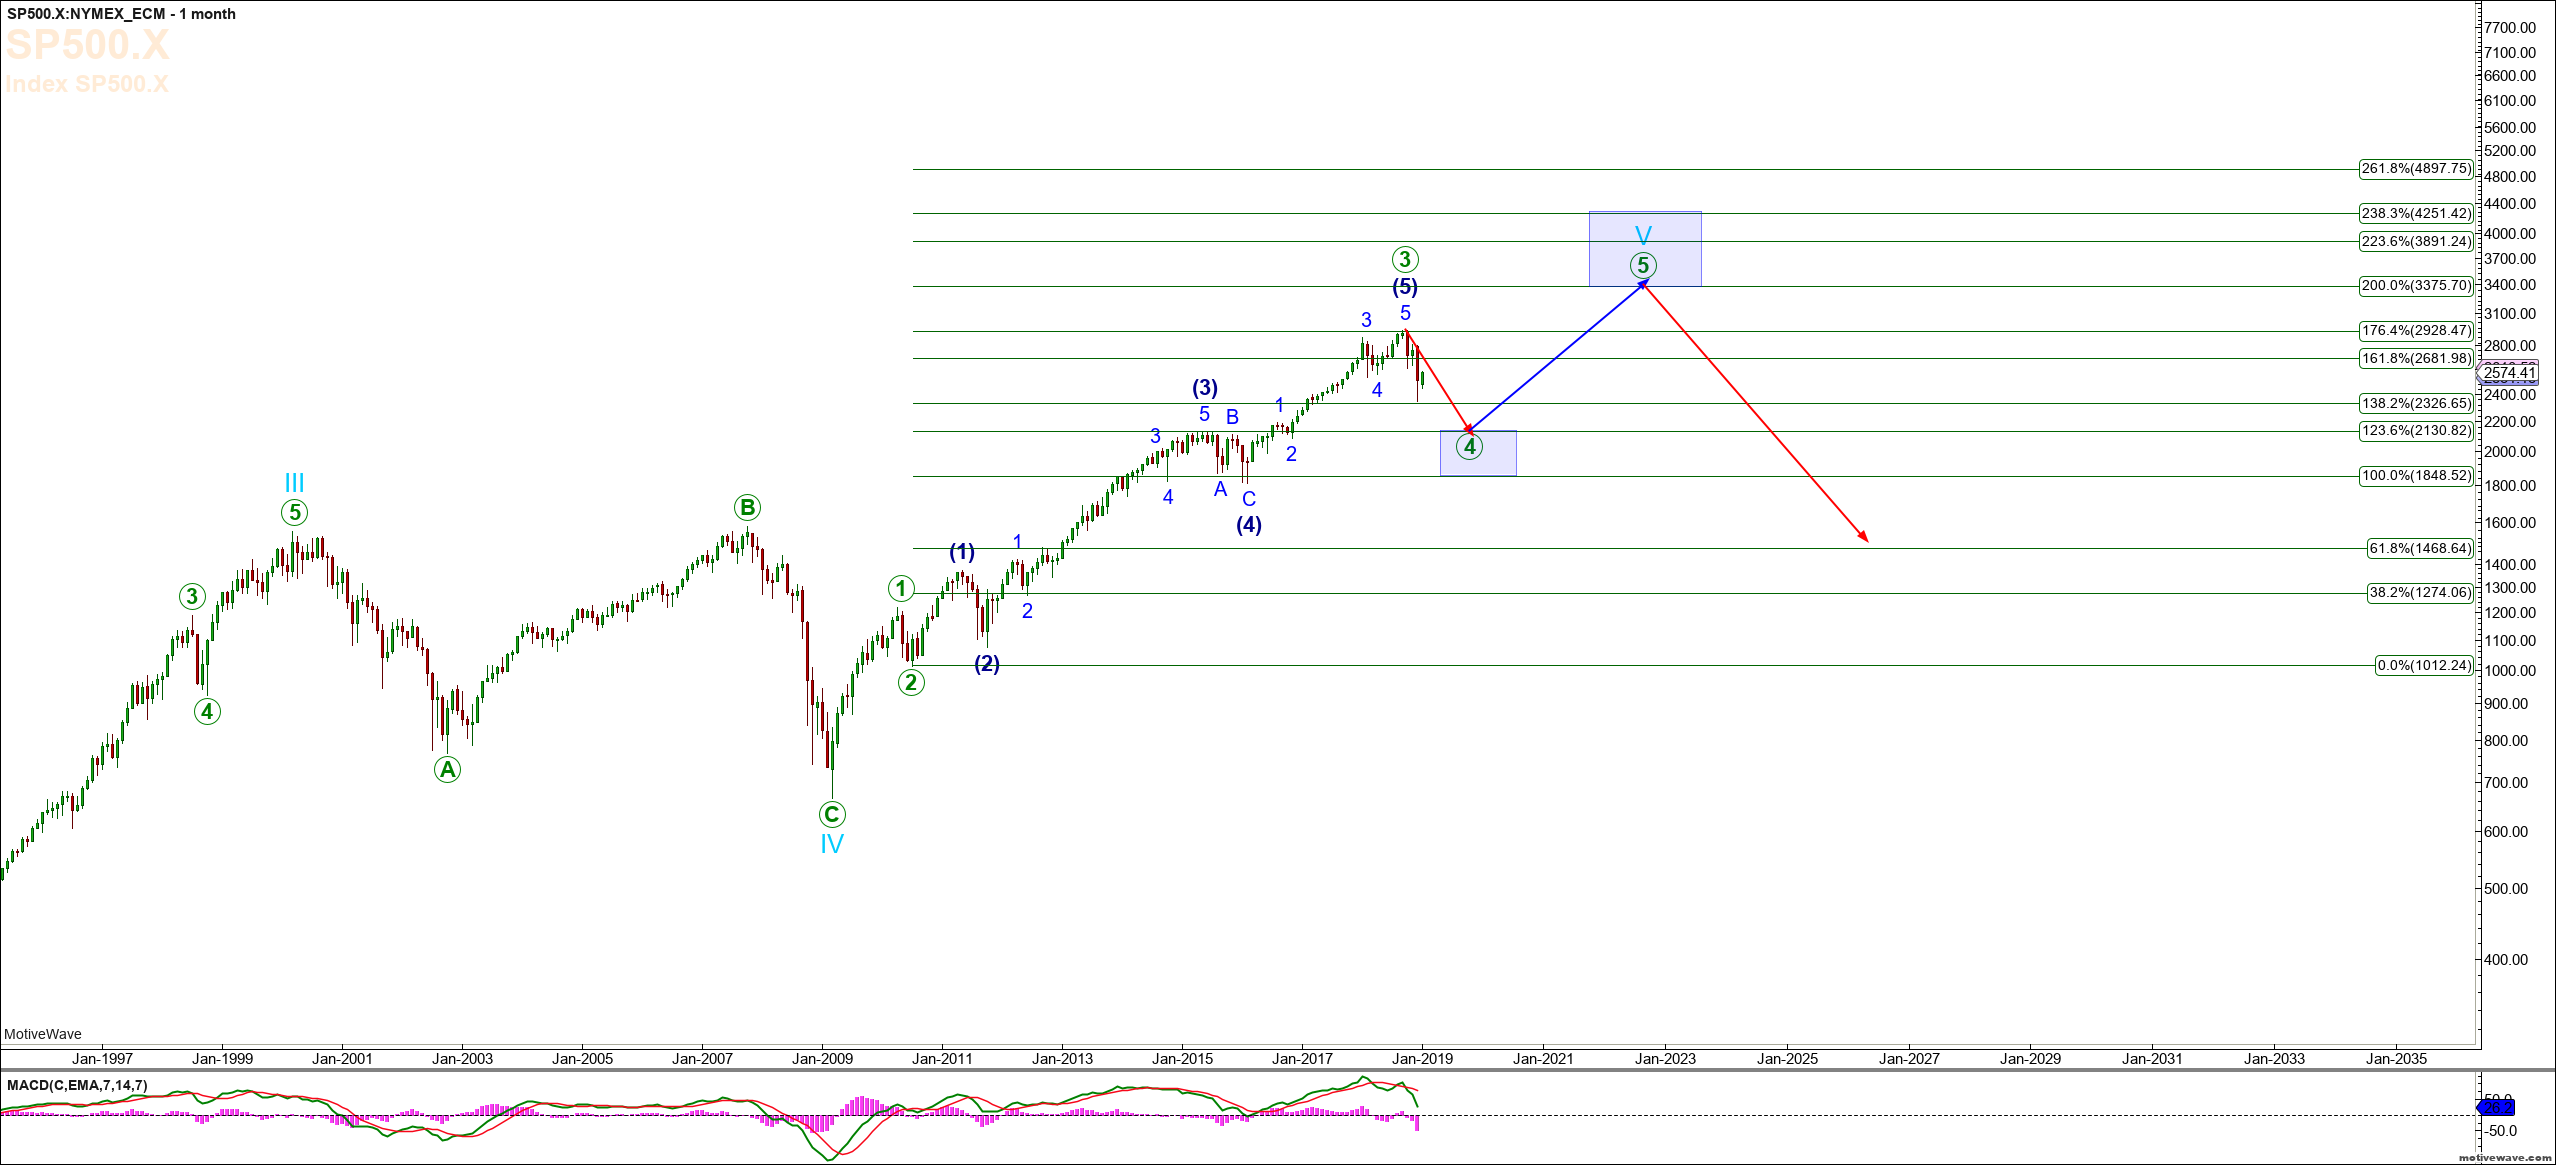
Could the WXY pattern off the high into the pre-Christmas low be the entire move down for Primary Degree Wave 4? Sure. From an investment or trading perspective, does having an answer to this question at this time really matter? No! To better understand why I would say this, allow me to explain.
For subscribers at our site, Michael Richards quit often focuses on certain legs of the move that are high confidence, which is effectively that portion of two alternative counts that are shared in common for a specific portion of the price movement. It is during this portion of price action we are most keen to position capital, as these are the high confidence portions of the move. Let’s face it, with 200 – 400 point moves occurring in the SPX, as an active investor you don’t have to position capital for every leg in order to rack up enormous returns in markets with swings of this magnitude. However, you do have to position capital for the most probable legs of the overall market machinations. On this basis, refer to the S&P 500 Emini Contract Chart below, and let’s consider the three most likely scenarios.
First, keep in mind that B-waves and 4th waves are the most difficult market action to trade, and for many going to cash and awaiting a capitulation low is as good a strategy as attempting to trade various legs of the correction. For those who are looking to be more active, here are the potentials.
While I understand this is a lot to digest, consider a few observations. Provided that SPX can break 2,611 and confirm a move down to 2,521 – 2,411, going long in this area can take advantage of a 300 – 400 point move up, and in the event the pre-Christmas low represents all of Primary Degree wave 4, investors can position for both a larger C-wave up or for SPX heading to new all time highs.
When we position investor capital or are advising our subscribers on entries, we are keenly focused on not just providing analysis, but identifying those portions of market machinations where both the primary directional thesis and the alternative directional thesis share a portion of price movement in common. This creates high confidence and attractive risk to reward skew, where in this instance one specific position trade can ferret out a 15% plus return (i.e. 400 upside points / SPX 2,400 level). It is not important to catch each and every move. It’s only important to participate in the high confidence portions of the move. Overtrading during periods of less confidence leads to loss of capital such that when the high confidence scenarios actually do present themselves, you’re in a position to take full advantage with well-preserved capital in hand. I see too often investors and traders suffer from the “fear of missing out” syndrome that leads to overtrading and loss of capital. Recognize the difference and know how to avoid trap doors in your trading efforts.
S&P 500 Emini Contract Chart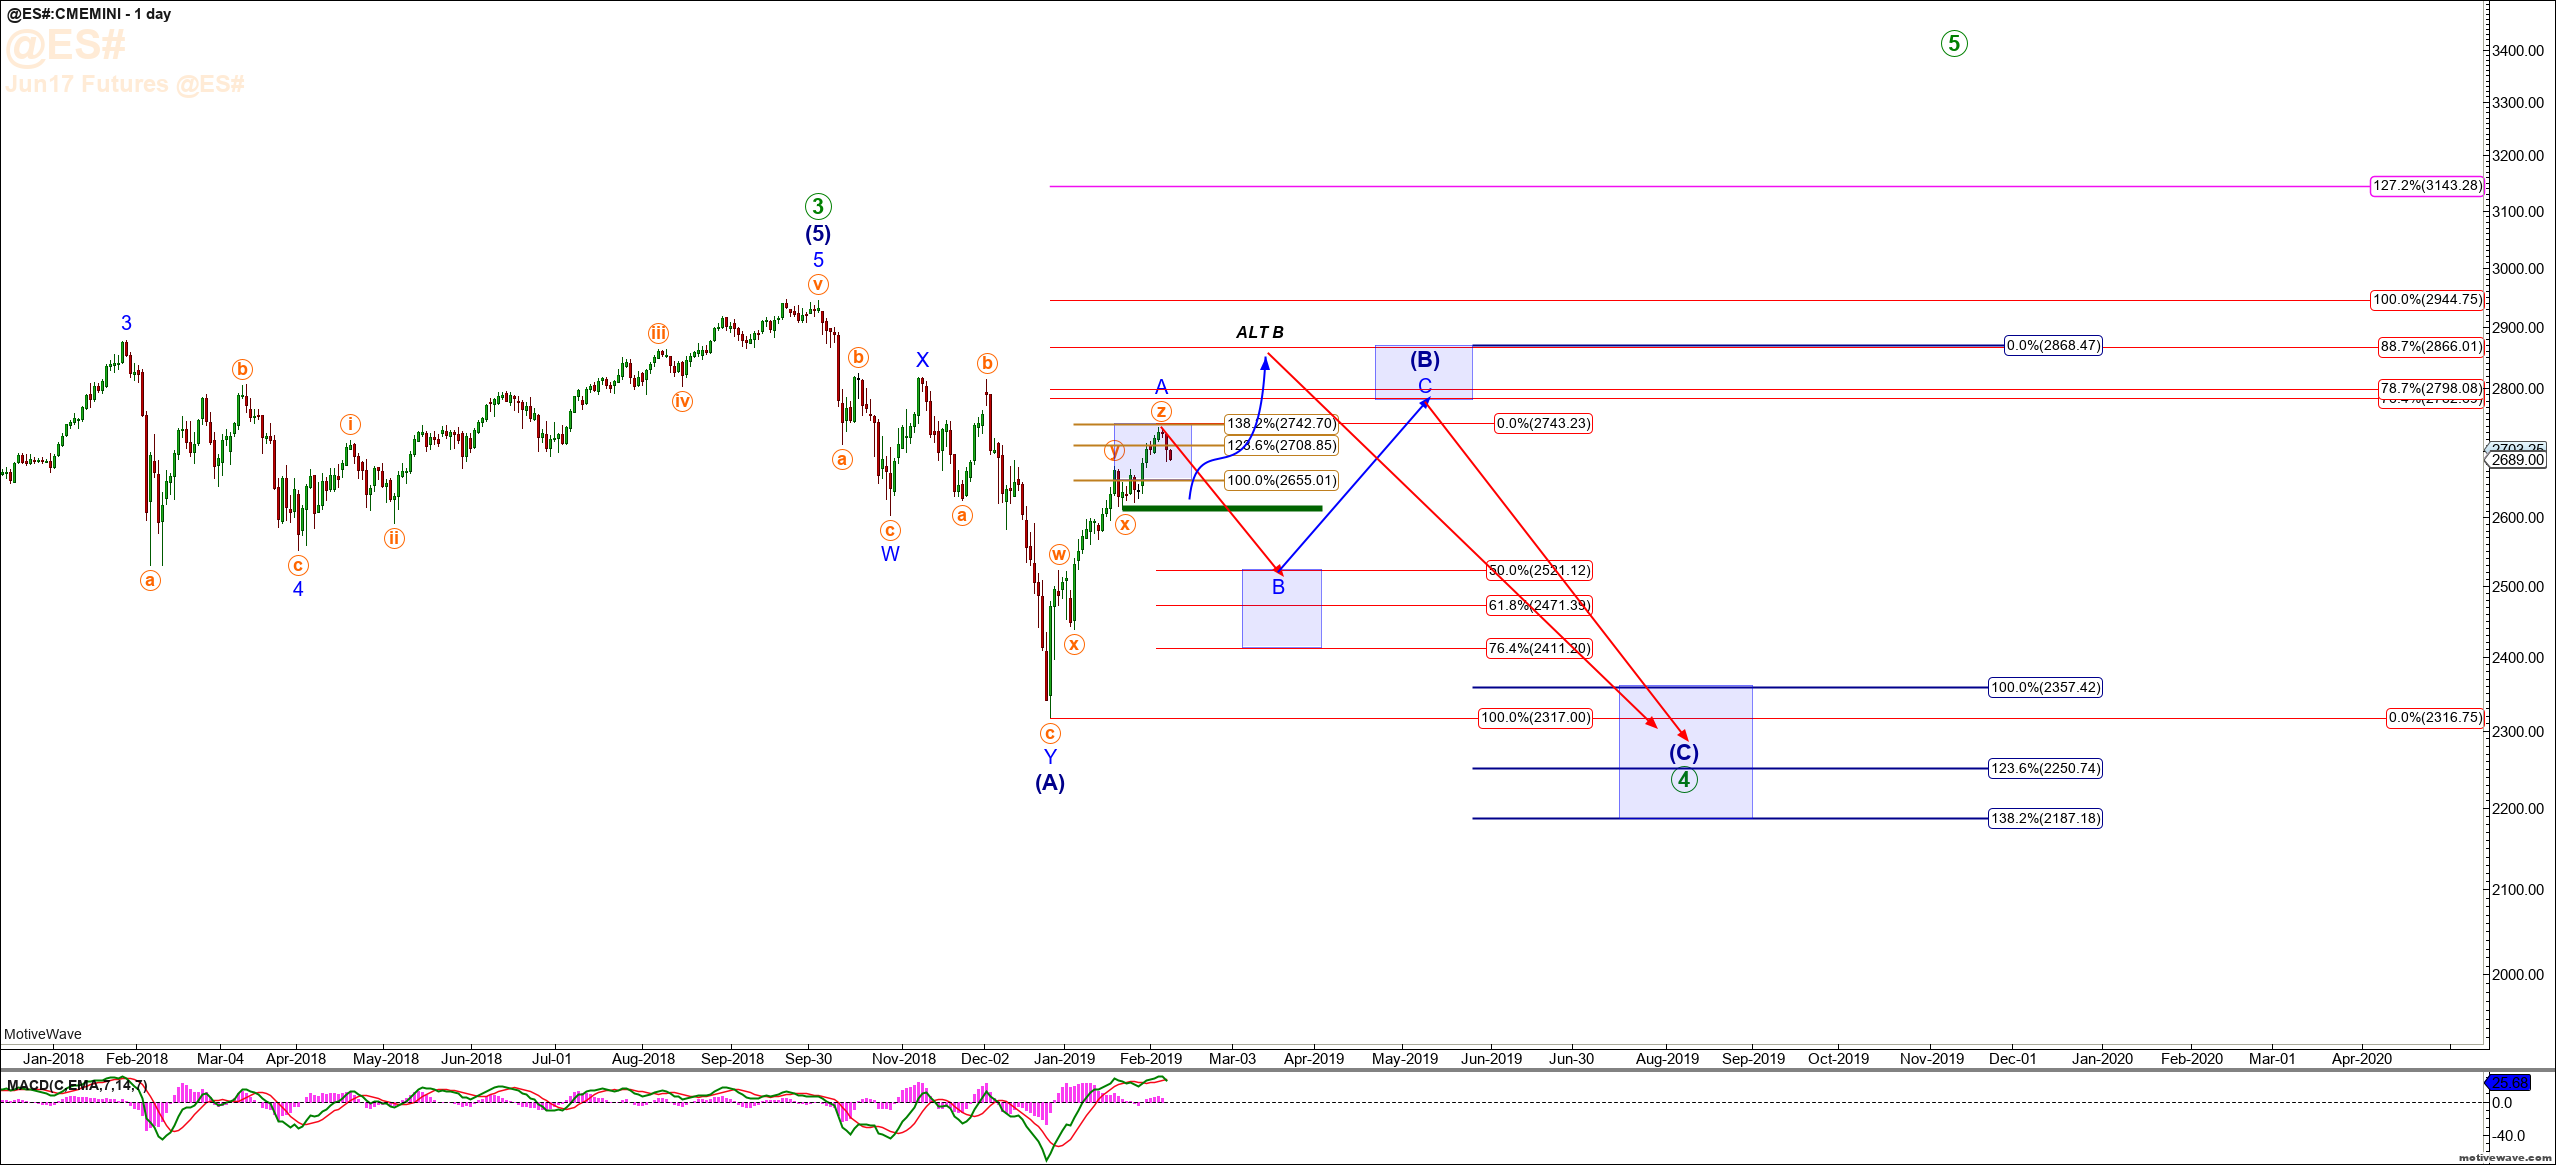 Concluding Comments
Right now, the SPX is in the middle of two potentials – one up, and one down. Until it can confirm which scenario is playing out, it’s better to sit safely in cash and patiently wait for the high confidence setup to allow you to position for a meaningful profit.
There are a number of very attractive and high confidence scenarios that are setting up. Look for the key support and resistance levels we've laid out herein, and then take full advantage with all your capital fully intact.