The policy
This privacy policy is for this website timepriceanalysis.com and served by timepriceanalysis.com and governs the privacy of its users who choose to use it.
It explains how we comply with the GDPR (General Data Protection Regulation), the DPA (Data Protection Act) [pre GDPR enforcement] and the PECR (Privacy and Electronic Communications Regulations).
This policy will explain areas of this website that may affect your privacy and personal details, how we process, collect,
manage and store those details and how your rights under the GDPR, DPA & PECR are adhere to. Additionally it will explain the use of cookies or software,
advertising or commercial sponsorship from third parties and the download of any documents, files or software made available to you (if any) on this website.
Further explanations may be provided for specific pages or features of this website in order to help you understand how we, this website and its third parties (if any)
interact with you and your computer / device in order to serve it to you. Our contact information is provided if you have any questions.
The DPA & GDPR May 2018
We and this website complies to the DPA (Data Protection Act 1998) and already complies to the GDPR (General Data Protection Regulation) which comes into affect from May 2018.
We will update this policy accordingly after the completion of the UK's exit from the European Union.
Use of Cookies
Please adhere to separate policy regarding the Use of Cookies.
Website Visitor Tracking
This website uses tracking software to monitor its visitors to better understand how they use it. The software will save a cookie to your computers hard drive in order to track
and monitor your engagement and usage of the website, but will not store, save or collect personal information.
Adverts and Sponsored Links
This website may contain sponsored links and adverts. These will typically be served through our advertising partners, to whom may have detailed privacy policies relating directly
to the adverts they serve.
Clicking on any such adverts will send you to the advertisers website through a referral program which may use cookies and will track the number of referrals sent from this website.
This may include the use of cookies which may in turn be saved on your computers hard drive. Users should therefore note they click on sponsored external links at their own risk and
we cannot be held liable for any damages or implications caused by visiting any external links mentioned.
Contact & Communication With us
Users contacting this us through this website do so at their own discretion and provide any such personal details requested at their own risk. Your personal information is kept private
and stored securely until a time it is no longer required or has no use.
Where we have clearly stated and made you aware of the fact, and where you have given your express permission, we may use your details to send you products/services information
through a mailing list system. This is done in accordance with the regulations named in 'The policy' above.
Email Mailing List & Marketing Messages
We operate an email mailing list program, used to inform subscribers about products, services and/or news we supply/publish. Users can subscribe through an online automated process
where they have given their explicit permission. Subscriber personal details are collected, processed, managed and stored in accordance with the regulations named in 'The policy' above.
Subscribers can unsubscribe at any time through an automated online service. The type and content of marketing messages subscribers receive, and if it may contain third party content,
is clearly outlined at the point of subscription.
External Website Links & Third Parties
Although we only looks to include quality, safe and relevant external links, users are advised to adopt a policy of caution before clicking any external web links mentioned throughout this website.
We cannot guarantee or verify the contents of any externally linked website despite our best efforts. Users should therefore note they click on external links at their own risk
and we cannot be held liable for any damages or implications caused by visiting any external links mentioned.
Social Media Policy & Usage
We adopt a Social Media Policy to ensure our business and our staff conduct themselves accordingly online. While we may have official profiles on social media platforms
users are advised to verify authenticity of such profiles before engaging with, or sharing information with such profiles. We will never ask for user passwords or personal details
on social media platforms. Users are advised to conduct themselves appropriately when engaging with us on social media.


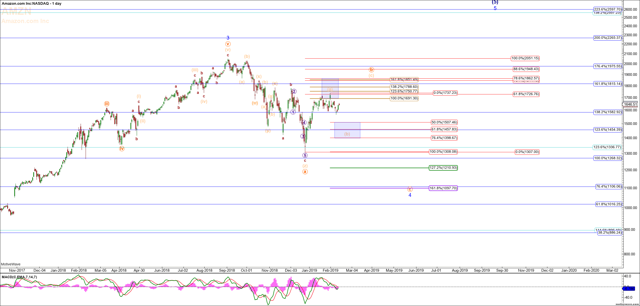
 Amazon.com Inc. (AMZN)