| Posted by Brian Fletcher on 08/03/2019 | 0 Comments |

After gold's move up from its September 2018 low, remaining patient a while longer should provide an even better entry point for the sector.
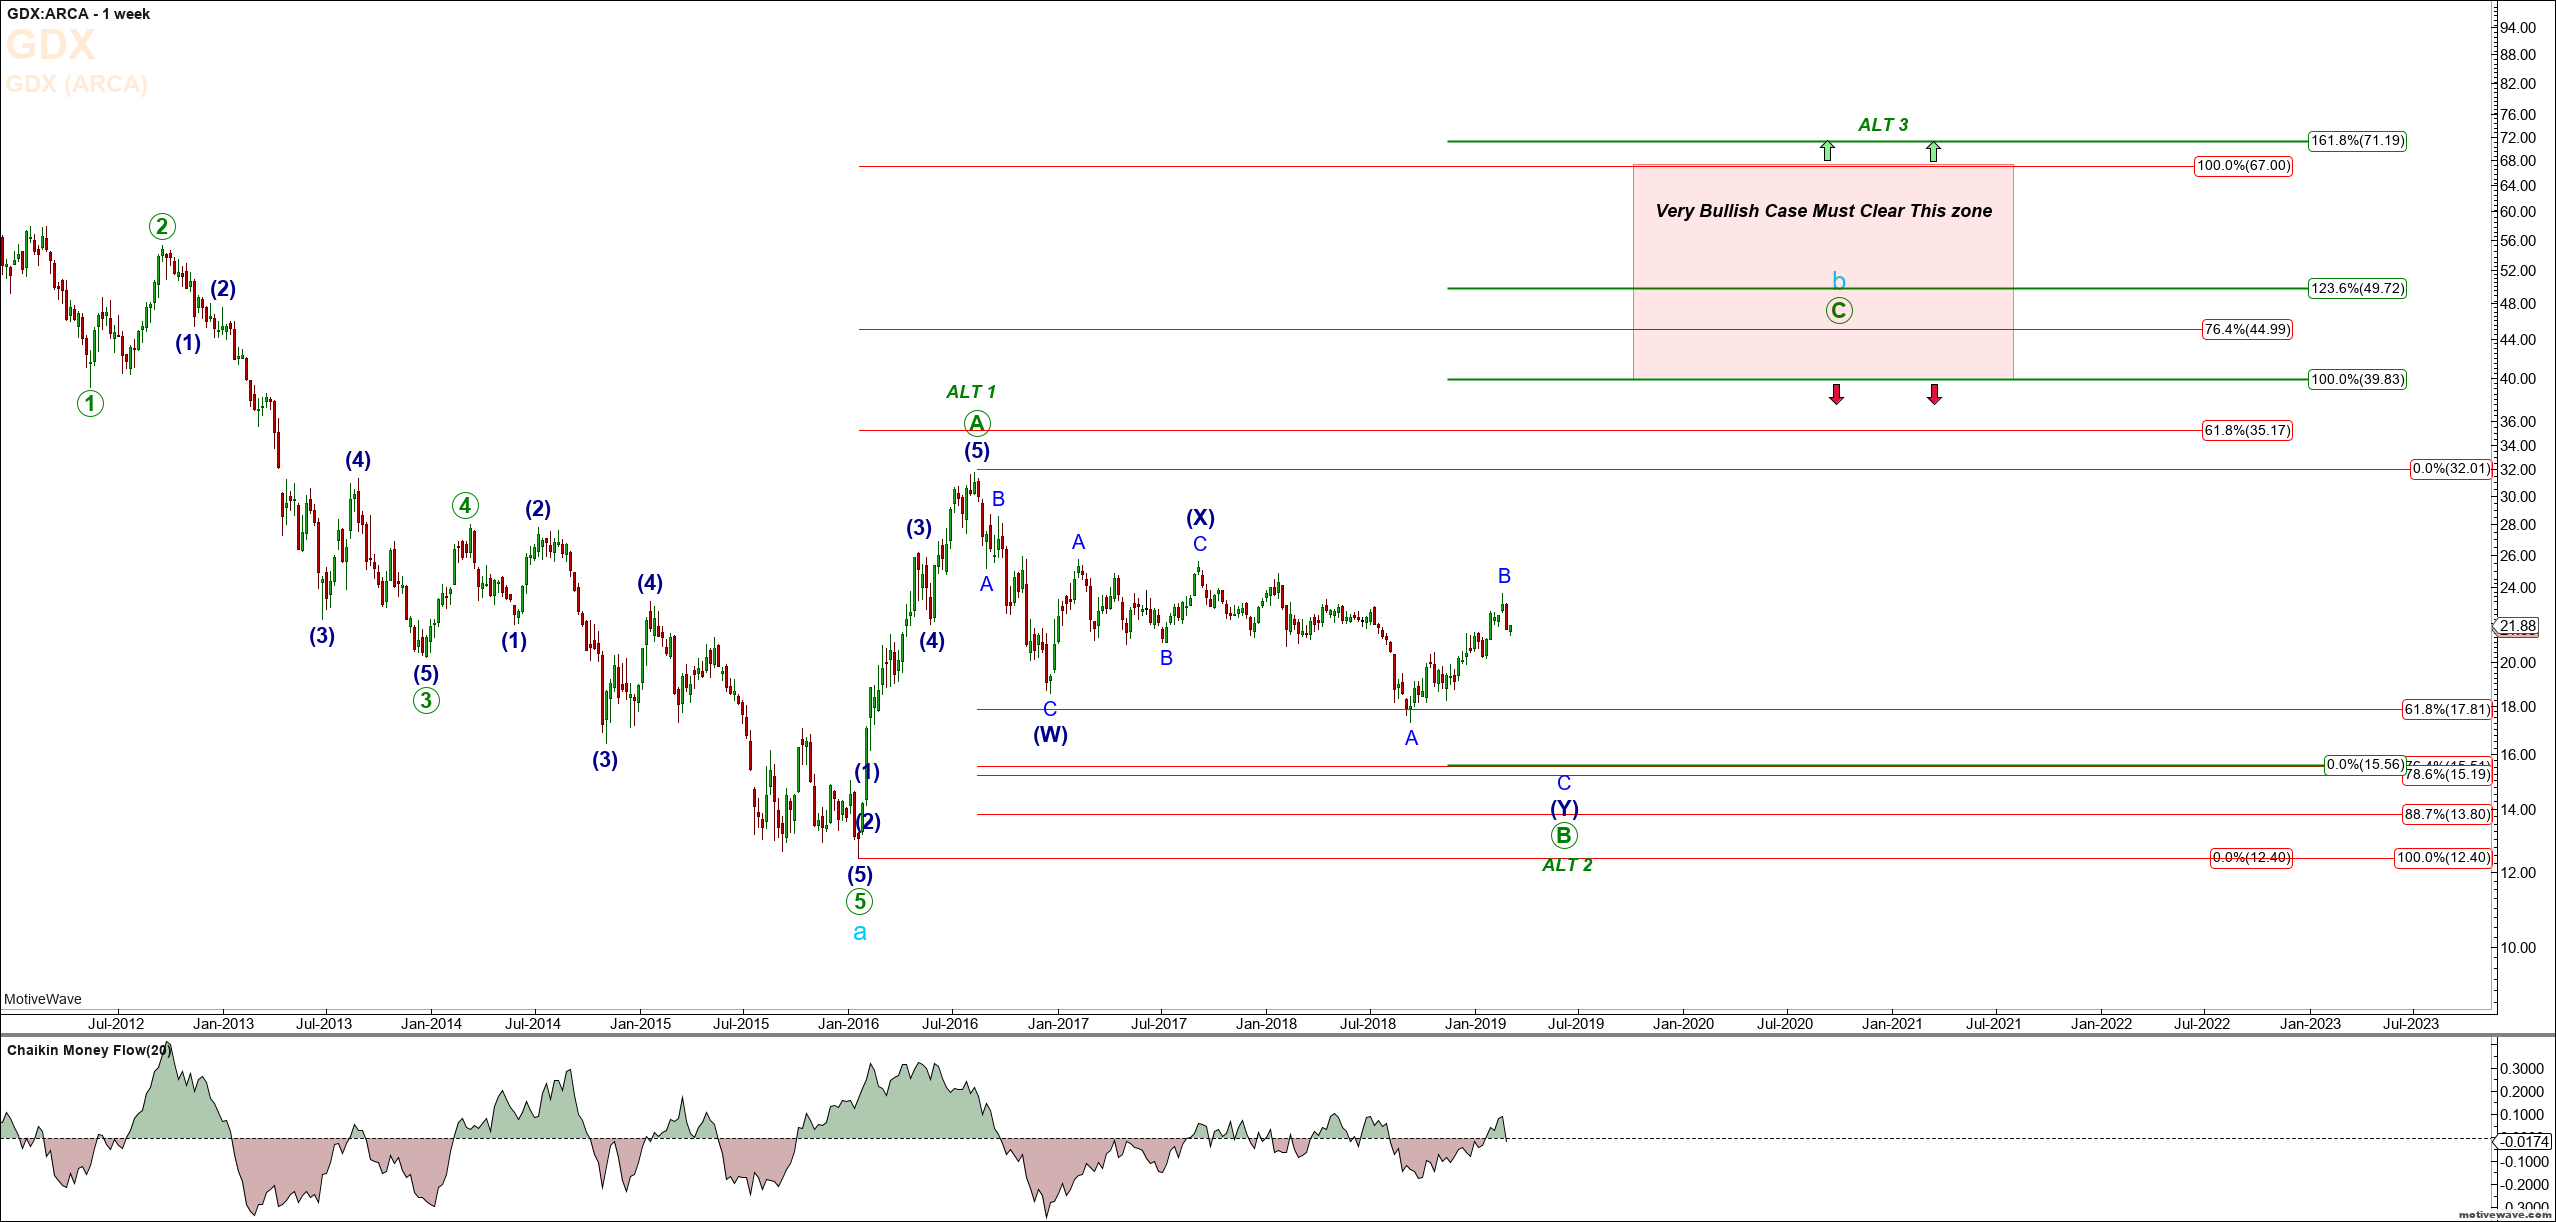
Lower levels into the $1,112 region in gold and the $15.50 region in GDX are still very much in the cards.
We will be watching the retracement levels closely on the next pull back.
When the metals and miners complex start a sustaining move to the upside, it can be breathtaking. Those who follow the miners sector know this all too well, as it’s one of the most emotional sectors in the market. Do not fear though, the train has not left the station without you. In this article I will discuss the lower price targets for gold and VanEck Vectors Gold Miners ETF (GDX), and how you have a great opportunity to go long into late summer, 2019. While GDX is the ETF that most closely resembles the large cap miners, we only use it as a proxy for the sector. Our primary focus will be on positioning into individual mining stock shares of companies that we have conducted our own thorough fundamental analysis.
In my last article on metals and miners I said:
Before getting into the meat and potatoes of the count, allow me to editorialize for a moment. With the possible exception of cryptocurrencies, I’ve seen very few investment sectors attract the extremes of investor and crowd emotions more than the precious metals mining sector. One of the many lessons long experience has taught me is that when emotions run high, investors make mistakes. It’s easy to see how this happens, after all in the first 7-months of 2016 the HUI Gold BUGS Index rallied from 99.80 to over 286 for a whopping 2.87x increase in value, creating the proverbial “fear of missing out” syndrome with many of those who failed to catch this enormous move. Following this move up, of course, was countless analysts who took full advantage to sensationalize the sector while attracting large audiences to their services by espousing premature entries, leaving their followers paying a very dear price.
The simple truth is that correction action is nothing short of very difficult, where corrections can exhibit as many as 13 different wave structures, leaving those who are experts in the field of Elliott Wave Analysis constantly using clues to determine what corrective structure is actually taking place, while at the same time seeking in good faith to provide investors who follow their analysis opportunities to enter for the next phase of the move up. As time goes on, and as corrective action continues, more and more clues are brought into the mix allowing one to begin to exclude certain structures and narrow the outcomes. Unfortunately, by the time this process ultimately plays out, investors who track along and take real money positions in sectors like precious metals miners have not only grown weary awaiting the elusive move up, but many have taken huge drawdowns in their capital. Of course, this process is exacerbated by the flurry of fundamental analysts who get on board near the highs as well, drawing investors into the sector at precisely the wrong time. By the time the entry is at hand, most who were initially focused on taking entries have experienced such enormous losses that they’ve mentally discounted the sector forever, resulting in failure to participate when a meaningful move to the upside finally does occur.
Nothing about the move up off last September’s low negates this advice, and the move up can very well be corrective in nature versus in the initial leg up. The first clue supporting that the move off the September low is corrective in nature is that the move up in gold started with a 3-wave move. Impulsive moves that suggest the next leg up has commenced do not start with 3 waves, but rather start with a 5 wave structure. Corrective moves and diagonals start in 3 wave moves. Therefore, probabilities significantly favor the move up that commenced in 3-waves is either a corrective move with new lows to follow, or a leading diagonal. If gold is forming a leading diagonal versus a corrective move that will make another low below that of the low established last September, then a diagonals typically retrace deep. Said differently, this would suggest at a minimum that gold and GDX will retrace back to a level that is very deep to the move up that's occurred.
All this to say, if gold has formed a leading diagonal, then it will drop substantially from current levels before heading higher. We will be closely watching the retracement levels against this move up to hold, and providing they do, we will be looking to go long in the $1,200 region. However, our primary expectation is still that gold will fool the masses by taking out the low established in late 2016, but at the same time hold over the low established in late 2015 for a final Y-wave into the $1,112 region.
I feel reasonably certain that projecting a move to $1,112 region is not a widely accepted view at this time. The enormous emotions and crowd sentiment in this sector will be expressed by naysayers to my suggestion of lower levels. However, this has been a long time target of ours, and while gold has managed to catch a bid in the late part of the last two years that forced price higher, thus delaying the final target to be met, the larger Elliott Wave would look cleaner with a move down to our expected price target.
Now, don’t read into this that we will be stubborn and miss the larger move up. After all, no one wants to miss such an enormous move to the upside, and given the choice of making significant profits vs. being right, we choose profits every time. It’s for this reason that we will be watching the retrace levels against the move off the September 2018 low very closely. We have done the fundamental and technical research of all the miner candidates, and know precisely which individual stocks we will recommend to our subscribers. If we enter early in the retrace scenario and then stop out, we may end up having to take two stabs for our entry, but we won't miss the move. That said, going long and riding a big and swift move down can be hazardous to your account, so we have little interest in going long early and sitting through the larger downside expectation that we have.
Gold Weekly Chart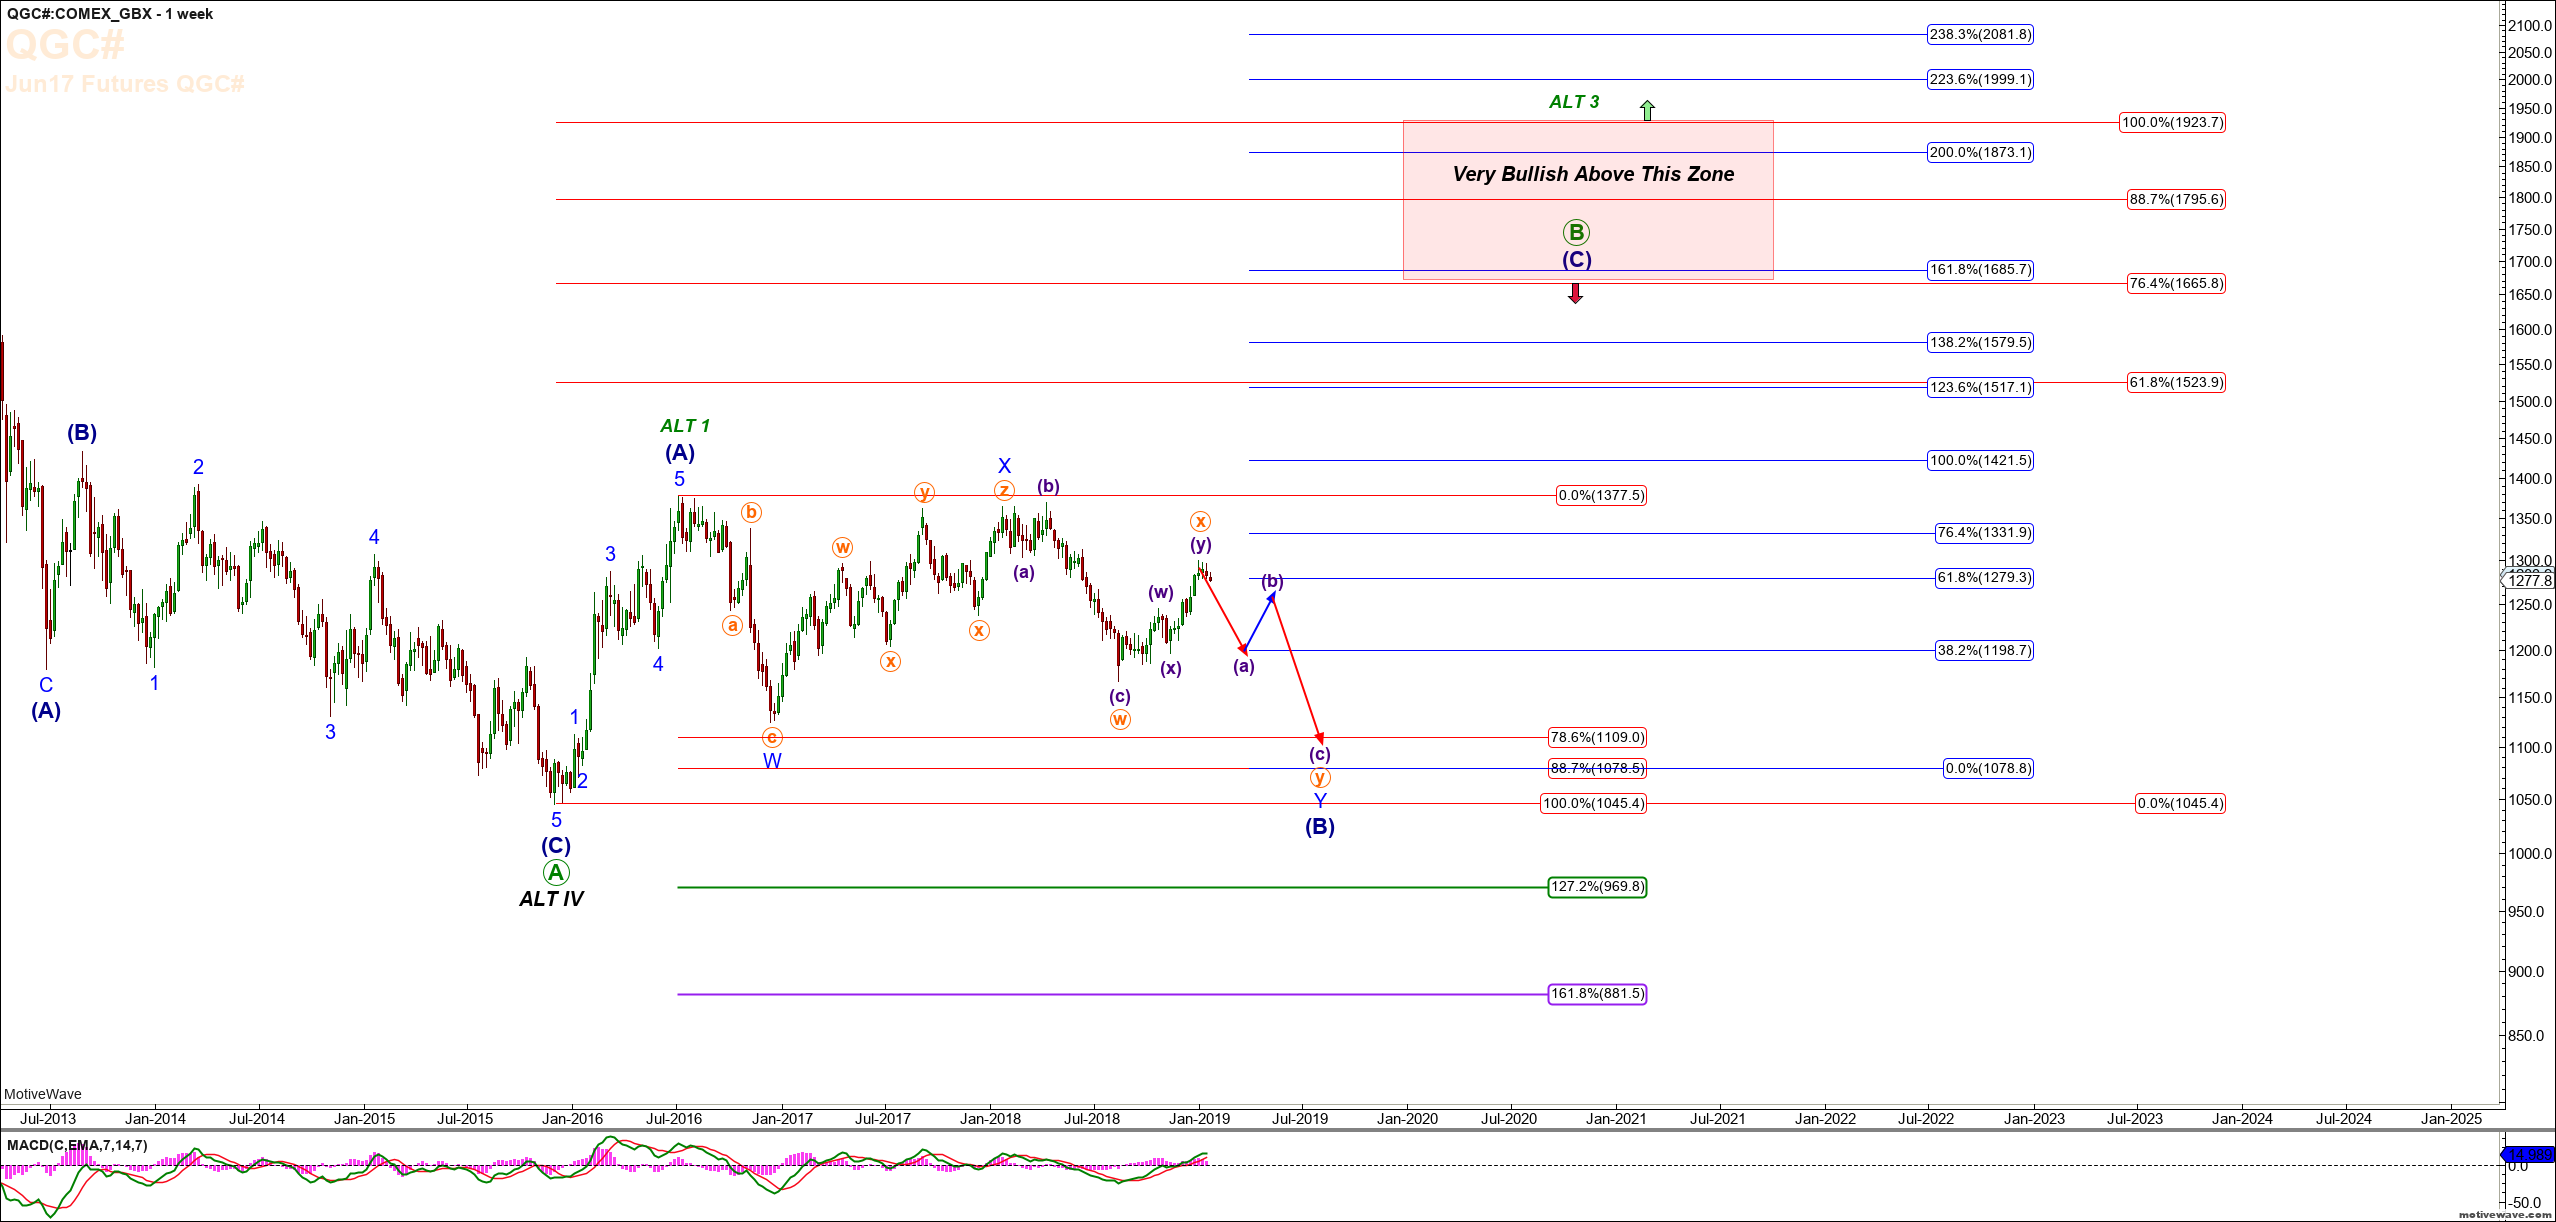
The area on the Daily Gold Chart bracketed by the green box entitled “Support” is the area to watch for a corrective move. If this area holds, then the entire move off the September 2018 low would suggest gold heads straight up. However, if this level fails to hold on the next pull back, look for the lower levels shown on the Weekly gold chart.
Gold Daily Chart
Similar to gold, we are looking for another low in GDX into the $15.50 region as shown on the Weekly Chart.
GDX Weekly Chart
Concluding Remarks
As I’ve said before, patience in the key in the metals and miners sector. The draw down to your account that can occur by chasing this complex can be very painful. I’ve heard too many horror stories from investors following analysts claiming breakouts only to get stuck in a position, or fail to exit on the breaking of support, that it is truly unnecessary.
Shortly, we will be introducing a Marketplace service called The Active Investor, for those following the S&P 500, gold, crude oil, natural gas, Bitcoin, and who are looking for a consistent flow of high reward relative to risk opportunities to allocate capital can follow our analysis. I will keep you abreast of further developments.