| Posted by Brian Fletcher on 21/08/2019 | 0 Comments |
More downside to persist in US equities.
Corrective market action is choppy and continues to tease market participants, but the trap door will open shortly.
Our expectations for completion of the first phase of this correction.
In my recent article on Seeking Alpha entitled U.S. Equities Market's Forthcoming 25% Correction, I discussed the overall Elliott Wave pattern that is highly supportive of a meaningful correction to equity prices.
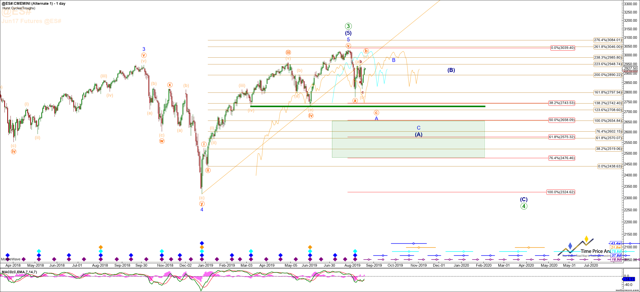
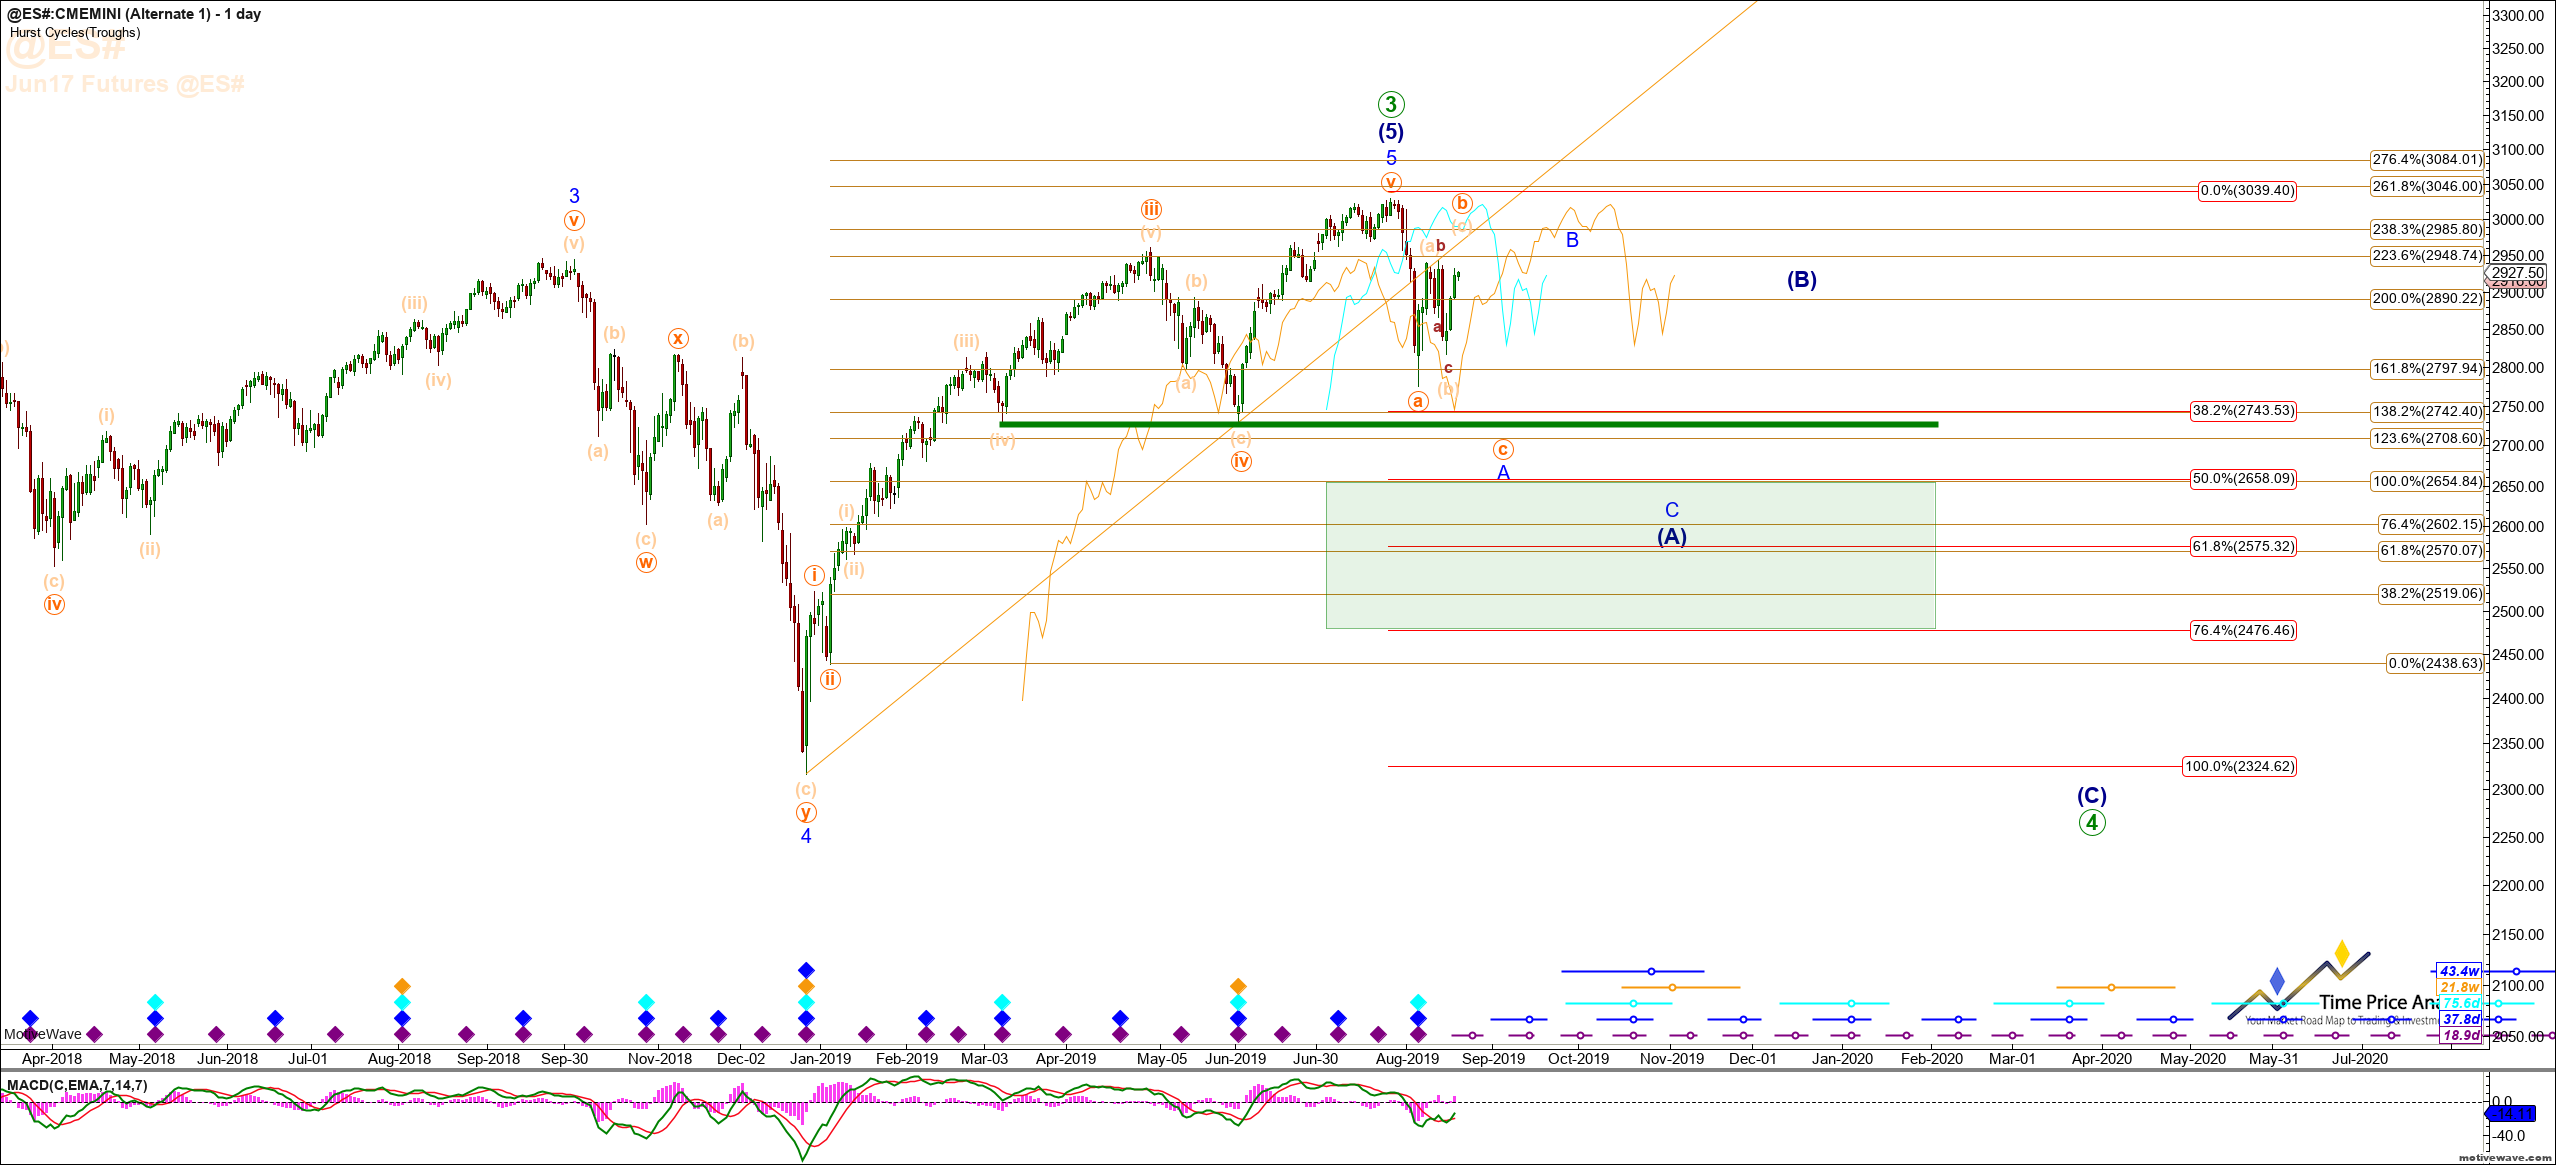
Herein I will provide an update. As I said, we are expecting the initial phase of this overall correction to complete into early November, 2019, to be followed by a larger overall bounce into early 2020, to be followed by a conclusion to the correction in mid 2020. See the Daily Chart below. Presently, we are working on the initial blue A wave down, which we anticipate will conclude over the next several weeks. We anticipate the larger (A) wave to conclude into early November of this year.
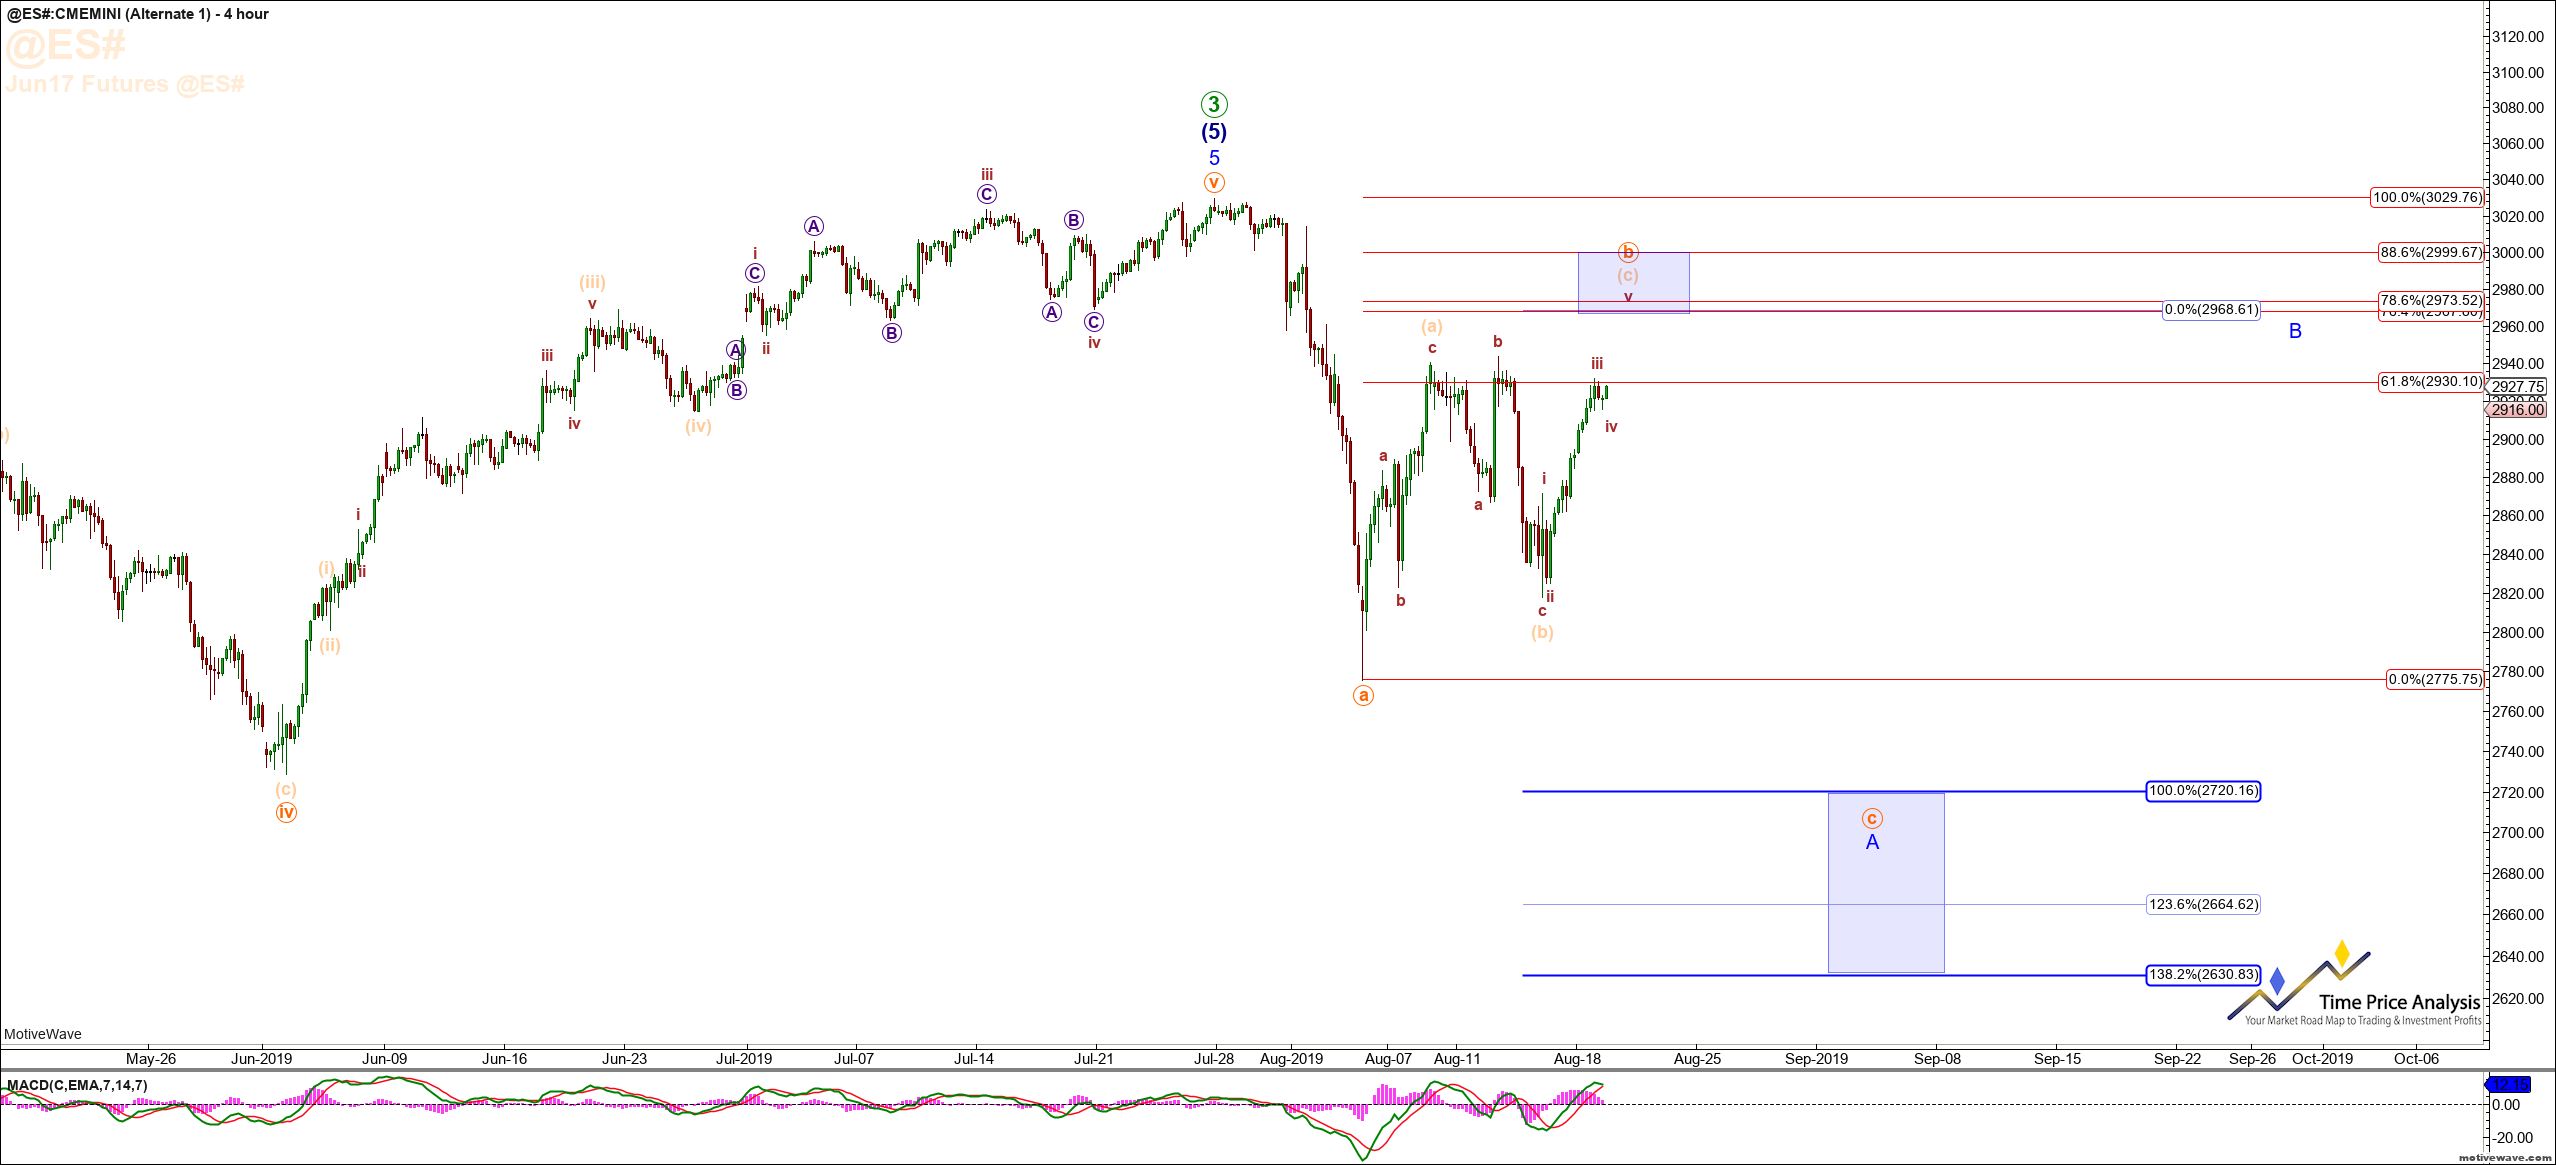
 Breaking it down further, by way of update, refer to the S&P E-mini Futures Contract 4 Hour Chart below. Corrective action is extremely difficult to chart, and as such to trade. Elliott Wave provides for 13 different corrective wave structures. Many times traders or investors will simply short the initial move down, then exit and look to enter again short after the corrective action completes, and not bother attempting to go long for the corrective portion itself. In viewing the chart below I believe you will see why this posture becomes self evident. In a word, it's ugly price action, and extremely unpredictable. The one thing that is predictable is that we are in a larger correction. At the moment, we are viewing the retracement of the initial move down into August 6th as a classic abc for an overall b-wave. While it needs to be understand that the pattern allows for the S&P to turn down in the 2930 region as a b-wave, it can also extend to the 2950 - 2970 region before turning down in an overall c-wave of the initial A, with a price target of 2720 - 2630. Again, we anticipate this to complete within the next two weeks, to be followed by a larger B wave move back up into the end of September.
We have notified our followers that we have begun to layer back into short positions using shares of ProShares UltraShort S&P 500 (SDS).
So, in conclusion, corrective wave structures are difficult to trade and it is important to recognize this early and simply understand the direction of the trend. Market tops are a process, market bottoms are an event, and corrective action is an exercise in frustration to those who attempt to trade both directions. We like to keep it simple, and right now the simplest conclusion we can draw by this market action is continuation to the downside.