| Posted by Brian Fletcher on 22/08/2019 | 0 Comments |
Crude Oil is setting up a number of VERY attractive trades in the next 12 months.
The recent corrective price action in crude oil has made it extremely difficult for traders.
Patience with the overall crude oil Elliott Wave pattern is key right now.
I have written about crude oil a number of times here on Time Price Analysis and provided our overall price level targets. We like crude oil for a host of reasons, but likely the three major reasons are that it adheres very nicely to Elliott Wave patterns, hits and respects the Fibonnaci levels with great consistency, and crude's percentage price movements are large enough in it's price movement amplitude that it makes for a perfect instrument for active investors to trade. In addition, there are ample Exchange Traded Funds and leveraged ETF, both to the long side and inverse to the underlying price of crude.
So, allow me to discuss both or short and long term price level targets for crude oil.
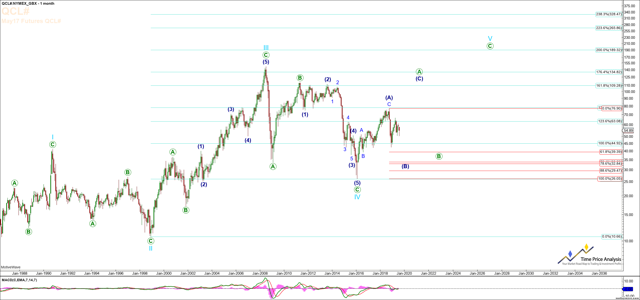
To gain a larger birds eye view of crude, take a look at the Crude Oil Monthly Chart below. Our very long term perspective is that crude is in a very large leading diagonal to the upside, ultimately targeting the $190 region. In the intermediate term (12-18 months) we are expecting a drop in crude to the low 30's. I've said this a number of times in other articles, and have frankly taken a certain amount of ridicule from readers, but if anyone is in doubt of whether this is possible or not, allow me to assure you that it is not only possible, but very probable.
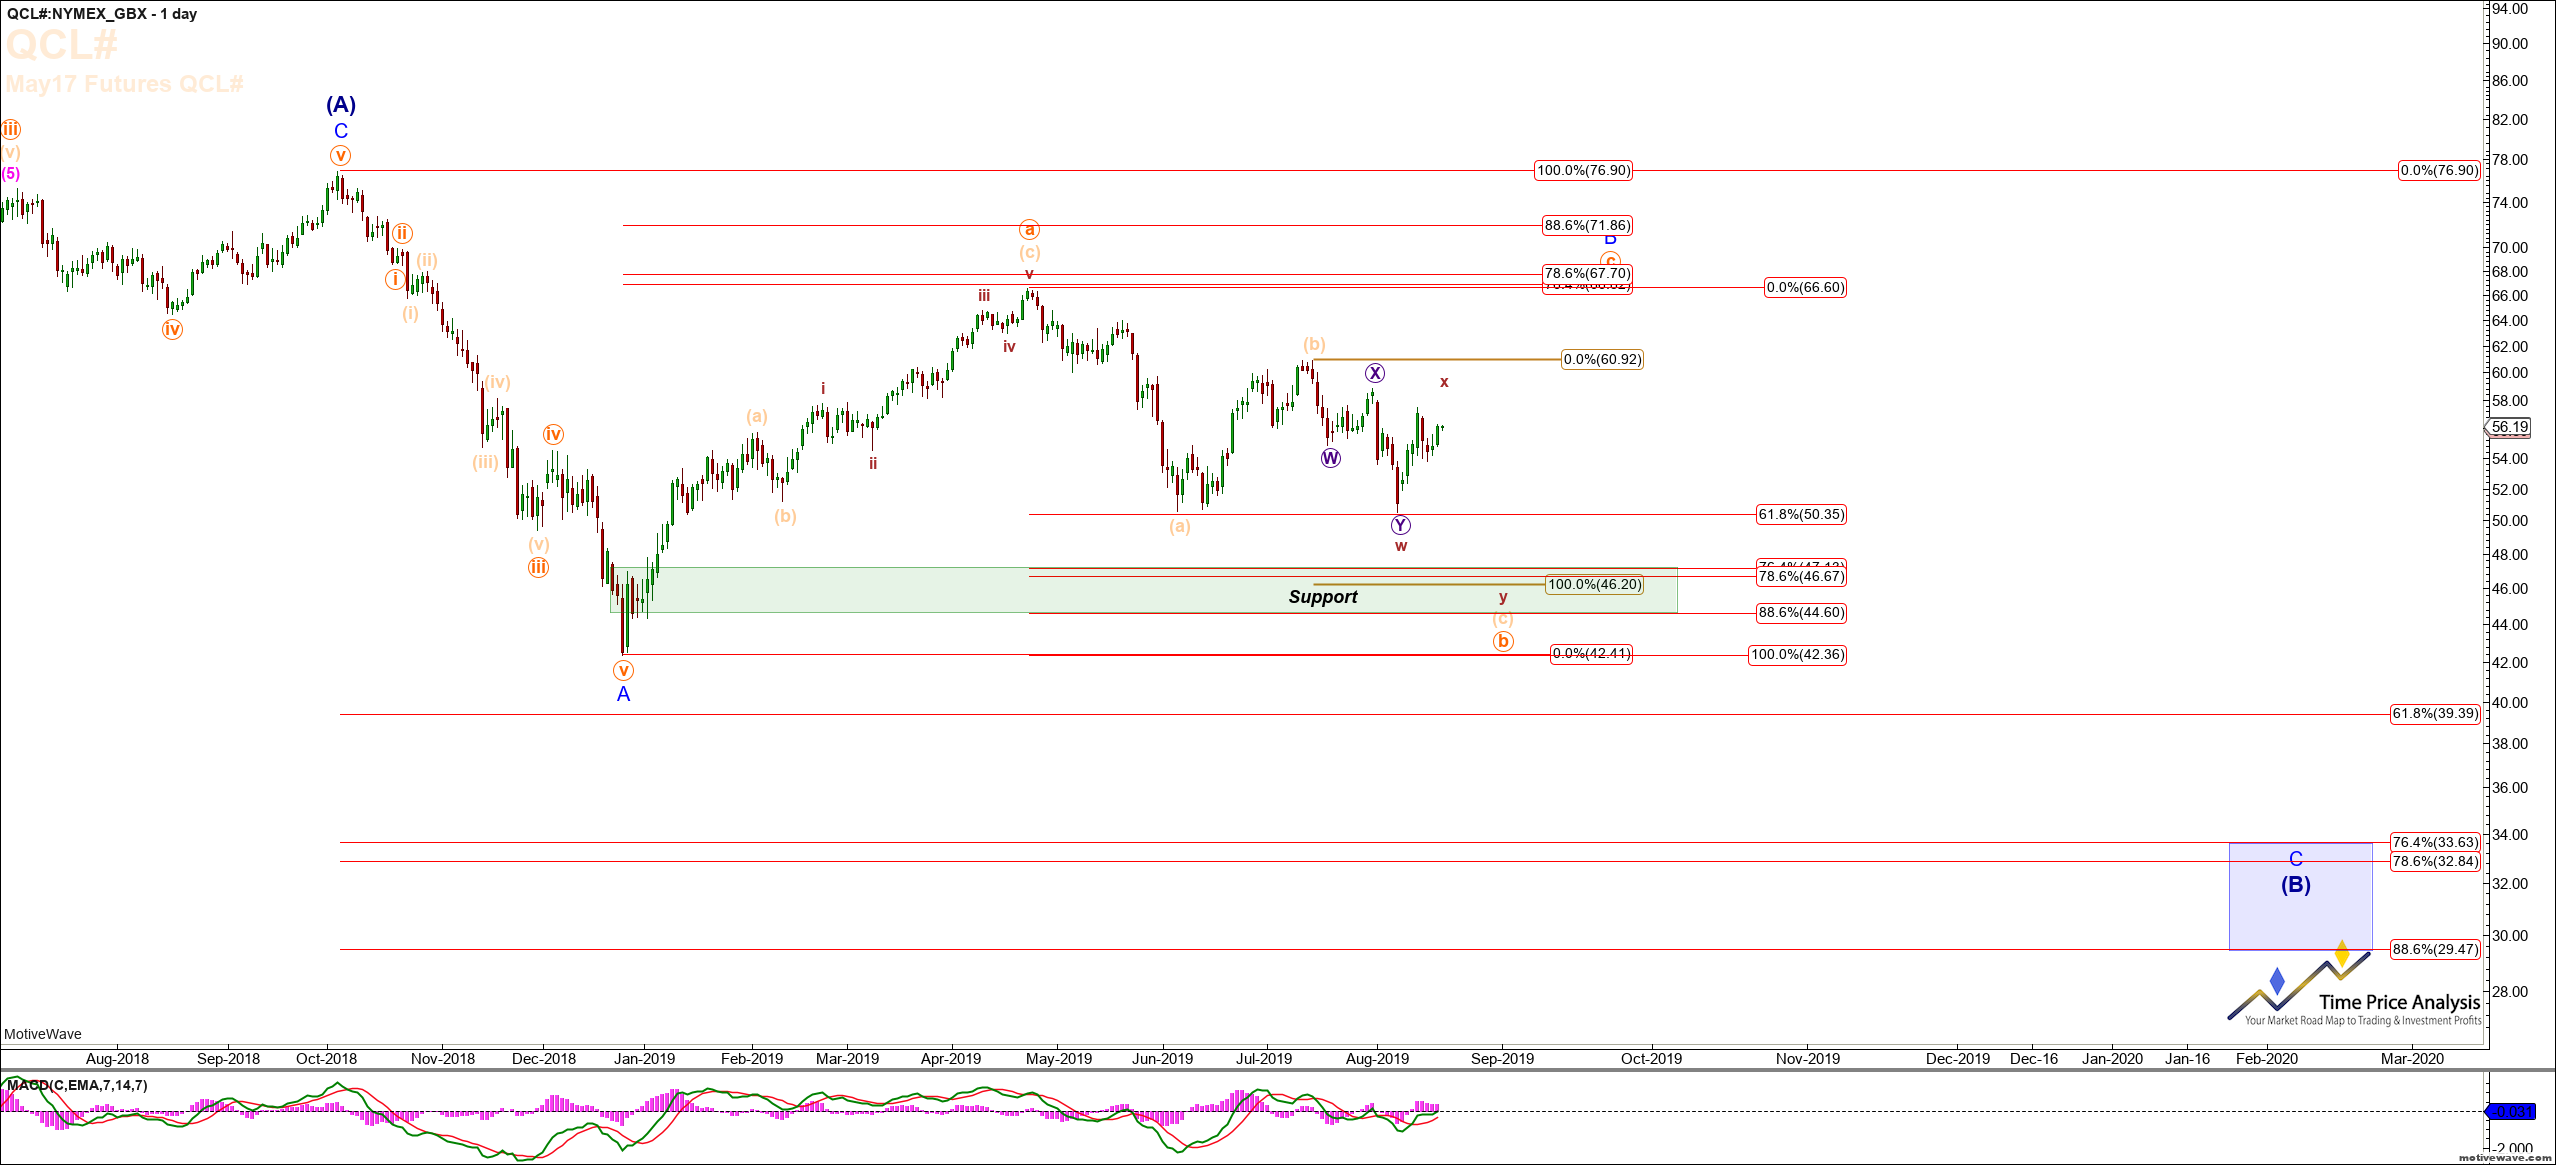
 Now allow me to discuss the intermediate term expectations for price movements in crude oil. Please refer to the Crude Oil Daily Chart below. We expect one of two levels to hold immediate upside in crude before a move to the $46 region. Either it holds at or below the $57 region, or may extend up to the 58.5o region. In either instance, we are expecting a move to $46, from one of these levels. On the Daily chart notice that this would result in a move back to the $67 region before completing the balance of the C of (B) wave low into the low 30's. Our expectation is that the final move down to the $32 region will not complete until next year, most likely coincident to the completion of the overall downside in the S&P 500 that I have recently discussed in US Equity Market's Forthcoming 25% Correction.
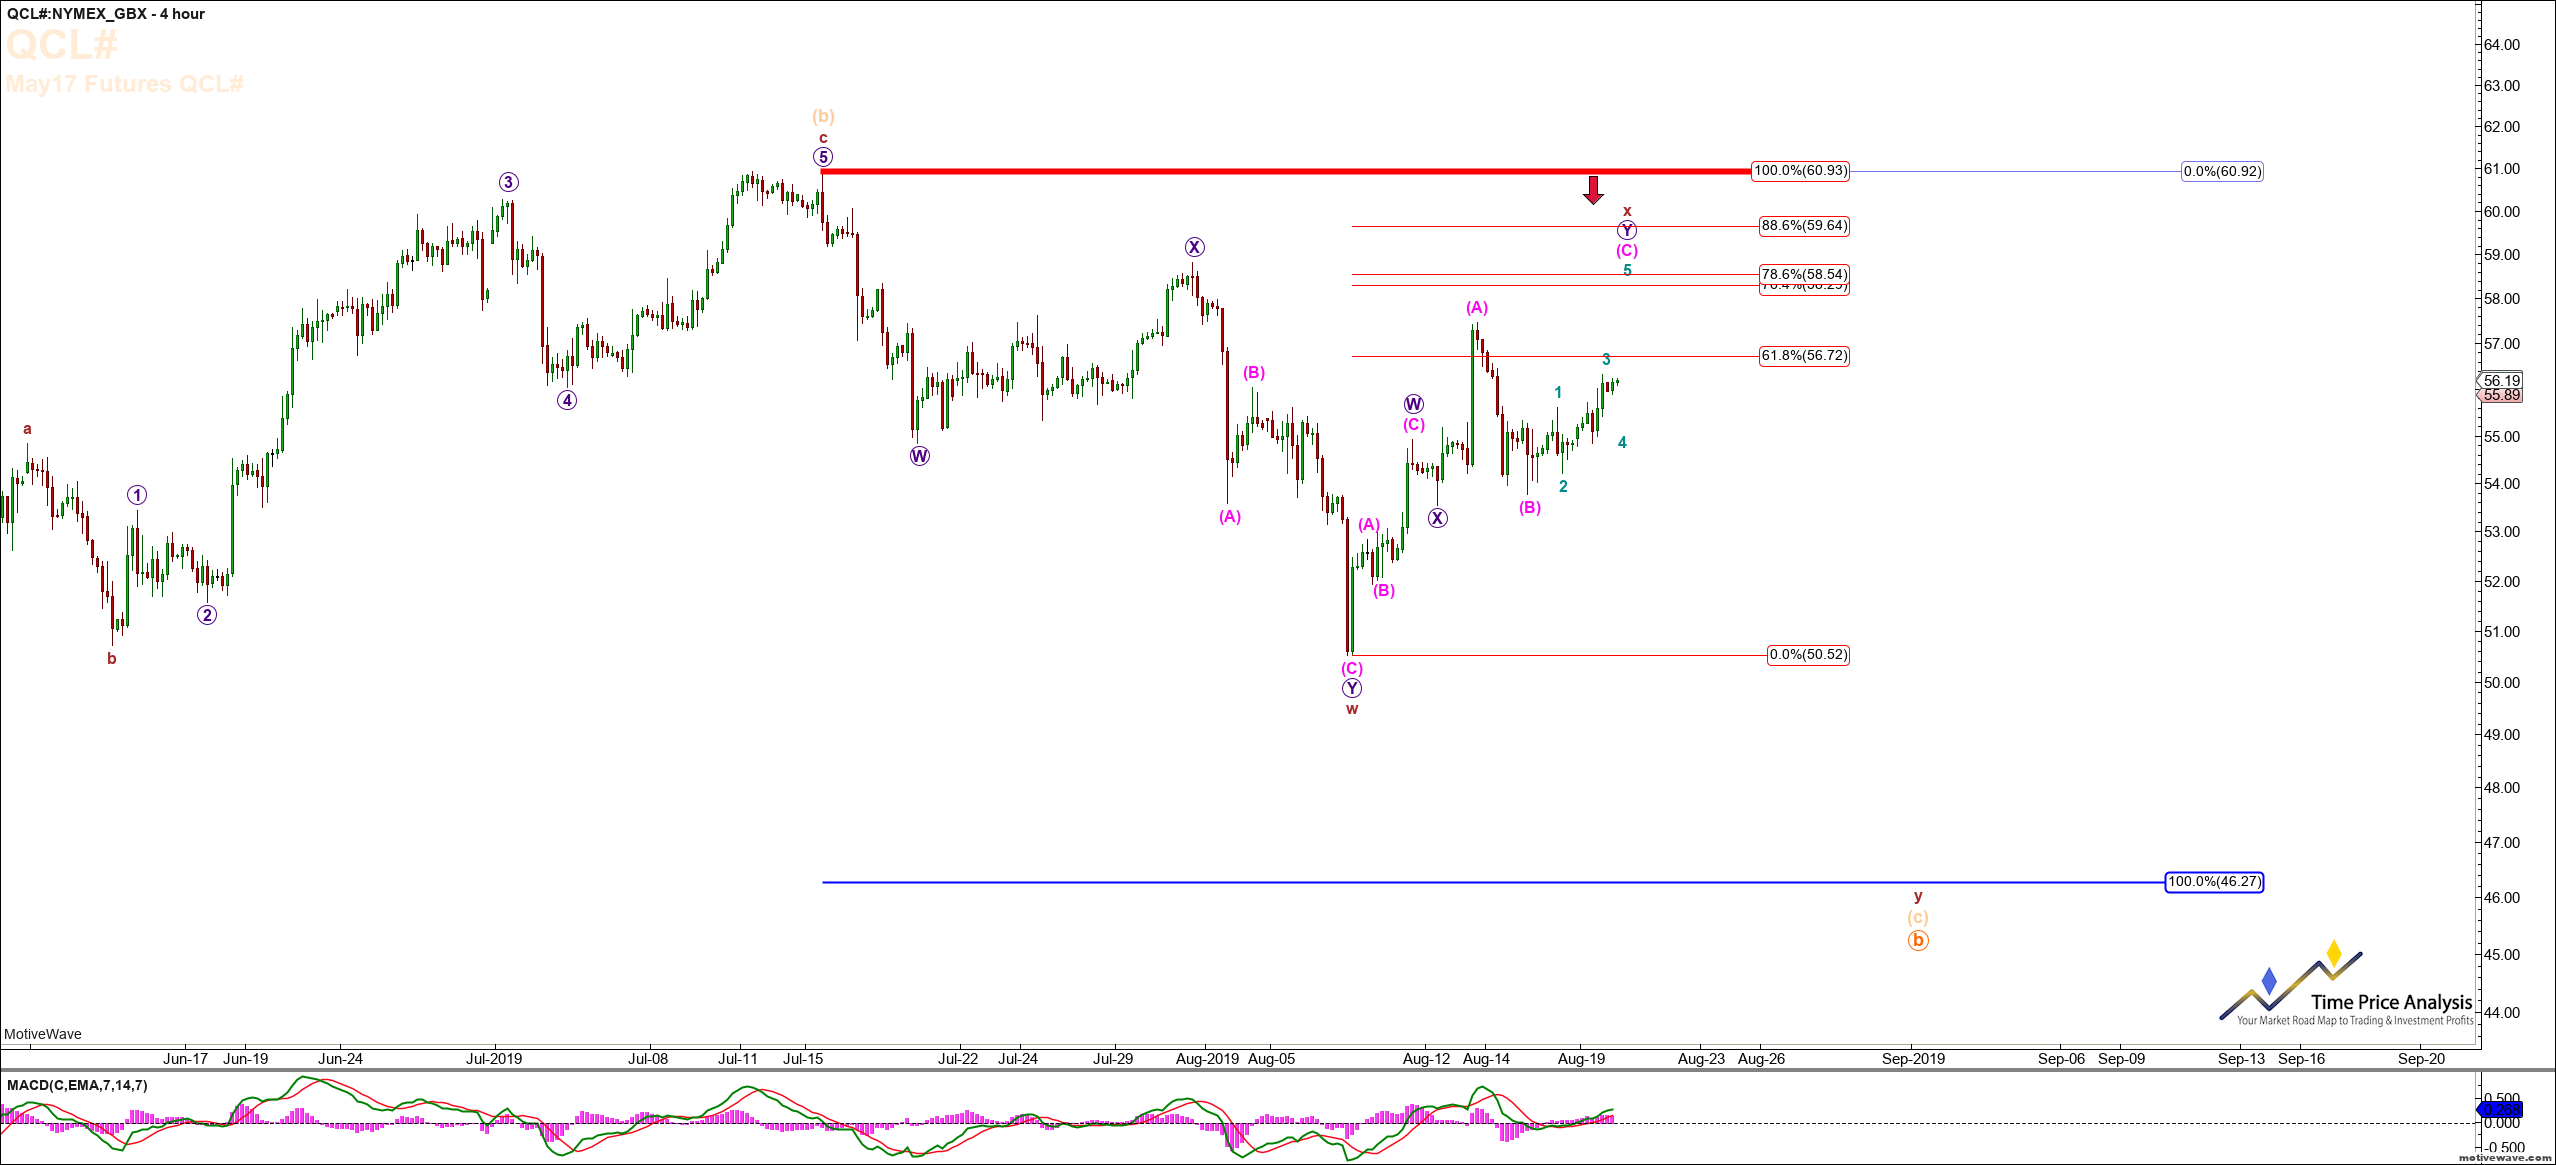
 Now, please turn your attention to the Crude Oil 4 Hour Chart and to better understand our short term expectations. I don't mind saying that recently crude has been very difficult on the smaller time frames. It is holding the Fib levels perfectly fine, but it offers a number of shorter term potentials. Our primary expectation is that it either holds the $57 region and then heads to $46 before setting up a multi-month move back to $67, or it concludes this current upside with a move to the $58.50 region before doing the same. As such, we tend to take trade attempts in both price target regions, as the Fib levels represented in these areas almost always solicit a reaction counter to the move going into it. Said differently, if we see a move into the $57 region that solicits a downside reaction, we will position short and put put our stop out level just over the high. If stopped out, we will look for the higher price target.
 We discuss these levels on our Active Investor site, our chat room, and in our twice per day video updates which allows our members to take full advantage of these investment opportunities.
In conclusion, we are expecting a move down to the $46 region, followed by a much larger move up to the $67 region, to then be followed by an even larger move down to the $32 region, all to occur over the next 12-14 months. For investors seeking to take advantage of some very large swing trade potentials, the opportunity to rack up some extraordinary profits exits in crude oil more so than most other sectors due to the extreme amplitude in price action. There are multiple ways to take advantage of the moves in crude oil, including using CL Futures contracts, and ETF's like United States Oil Fund (USO), ProShares UltraPro long and short ETF (OILD) and (OILU) which is a 3x leverage ETF, or ProShares UltraShort or Long ETFs (SCO) and (UCO), which is the 2x leveraged ETFs.