| Posted by Brian Fletcher on 04/09/2019 | 0 Comments |

The drop that occurred into August 6th caused technical damage to the equity markets that will provide a number of false starts before ultimately resolving to the downside.
Cash is a position too, and this is a time period for investors to either be in cash, fully hedged, or have short equity exposure.
Complacency and unrealistic expectations are common place characteristics of individual investors during this portion of the pattern cycle.
By way of background, on July 31st we published US Equity Market's Forthcoming 25% Correction, and at the same time we positioned our investors and subscribers into a full position of shares of ProShares UltraShort S&P 500 (SDS). Less than a week later we exited half this position, and have since re-entered and exited it two more times. Near the high this last week, we went to a full position short once again.
In this article I will re-iterate our intermediate and long term expectations for price levels and timing in the S&P 500.
Corrective equity markets are extremely unwieldy, and very choppy, and continue to tease and coax investors to go long, only to open a trap door each time it has effectively drawn in ample long exposure to allow the smart money to exit, leaving those who thought they were buying a dip wondering what just happened. From an Elliott Wave perspective, it is important to recognize and understand that since July 2010 the S&P 500 has been in a wave iii, and since October 2011 much of the move up from significantly lower levels has been a wave 3 of iii. 3rd waves are by their nature extremely robust, and rarely provide for meaningful pull backs to allow investors to climb aboard for the continued upside. By the time they conclude, investors have been trained by the market action to recognize that if they want to participate in the upside, they simply must buy the dips. The result of this is that by the time equity markets conclude wave iii, they commence in earnest a multi-month wave iv at the very moment that the masses have been properly trained by the market action to "buy the dip". In this case, from an Elliott Wave perspective, equity markets are in a Primary degree of trend, which is long term in nature. As such, many investors have now adequately forgotten that equity markets are not a linear trajectory to the upside. However, once the larger wave iii has concluded, buying the dip will only result in short term loss of capital when the various C-wave trap doors open to massive downside moves, resulting in unrecognized market action for those who have been trained by the 3rd wave to think otherwise.
Since the low that occurred in March 2009, the move up has adhered in picture perfect fashion to an Elliott Wave wave 5 impulse, and has further adhered by hitting text book Fibonnaci levels along the way.
In the July 31st article, I posted the following Daily Chart of the S&P 500 Emini Futures contract, which has continued to play out with reasonable precision. The circle b-wave has done exactly what b-wave's do, which is provide chop that contributes to confusion of market participants, while ultimately resolving down. While the b-wave may or may not be complete, nothing about this market action has changed our primary expectation that it will resolve down another time before providing a large bounce that will cause many to conclude the correction to be over, only to open another trap down to much lower levels.
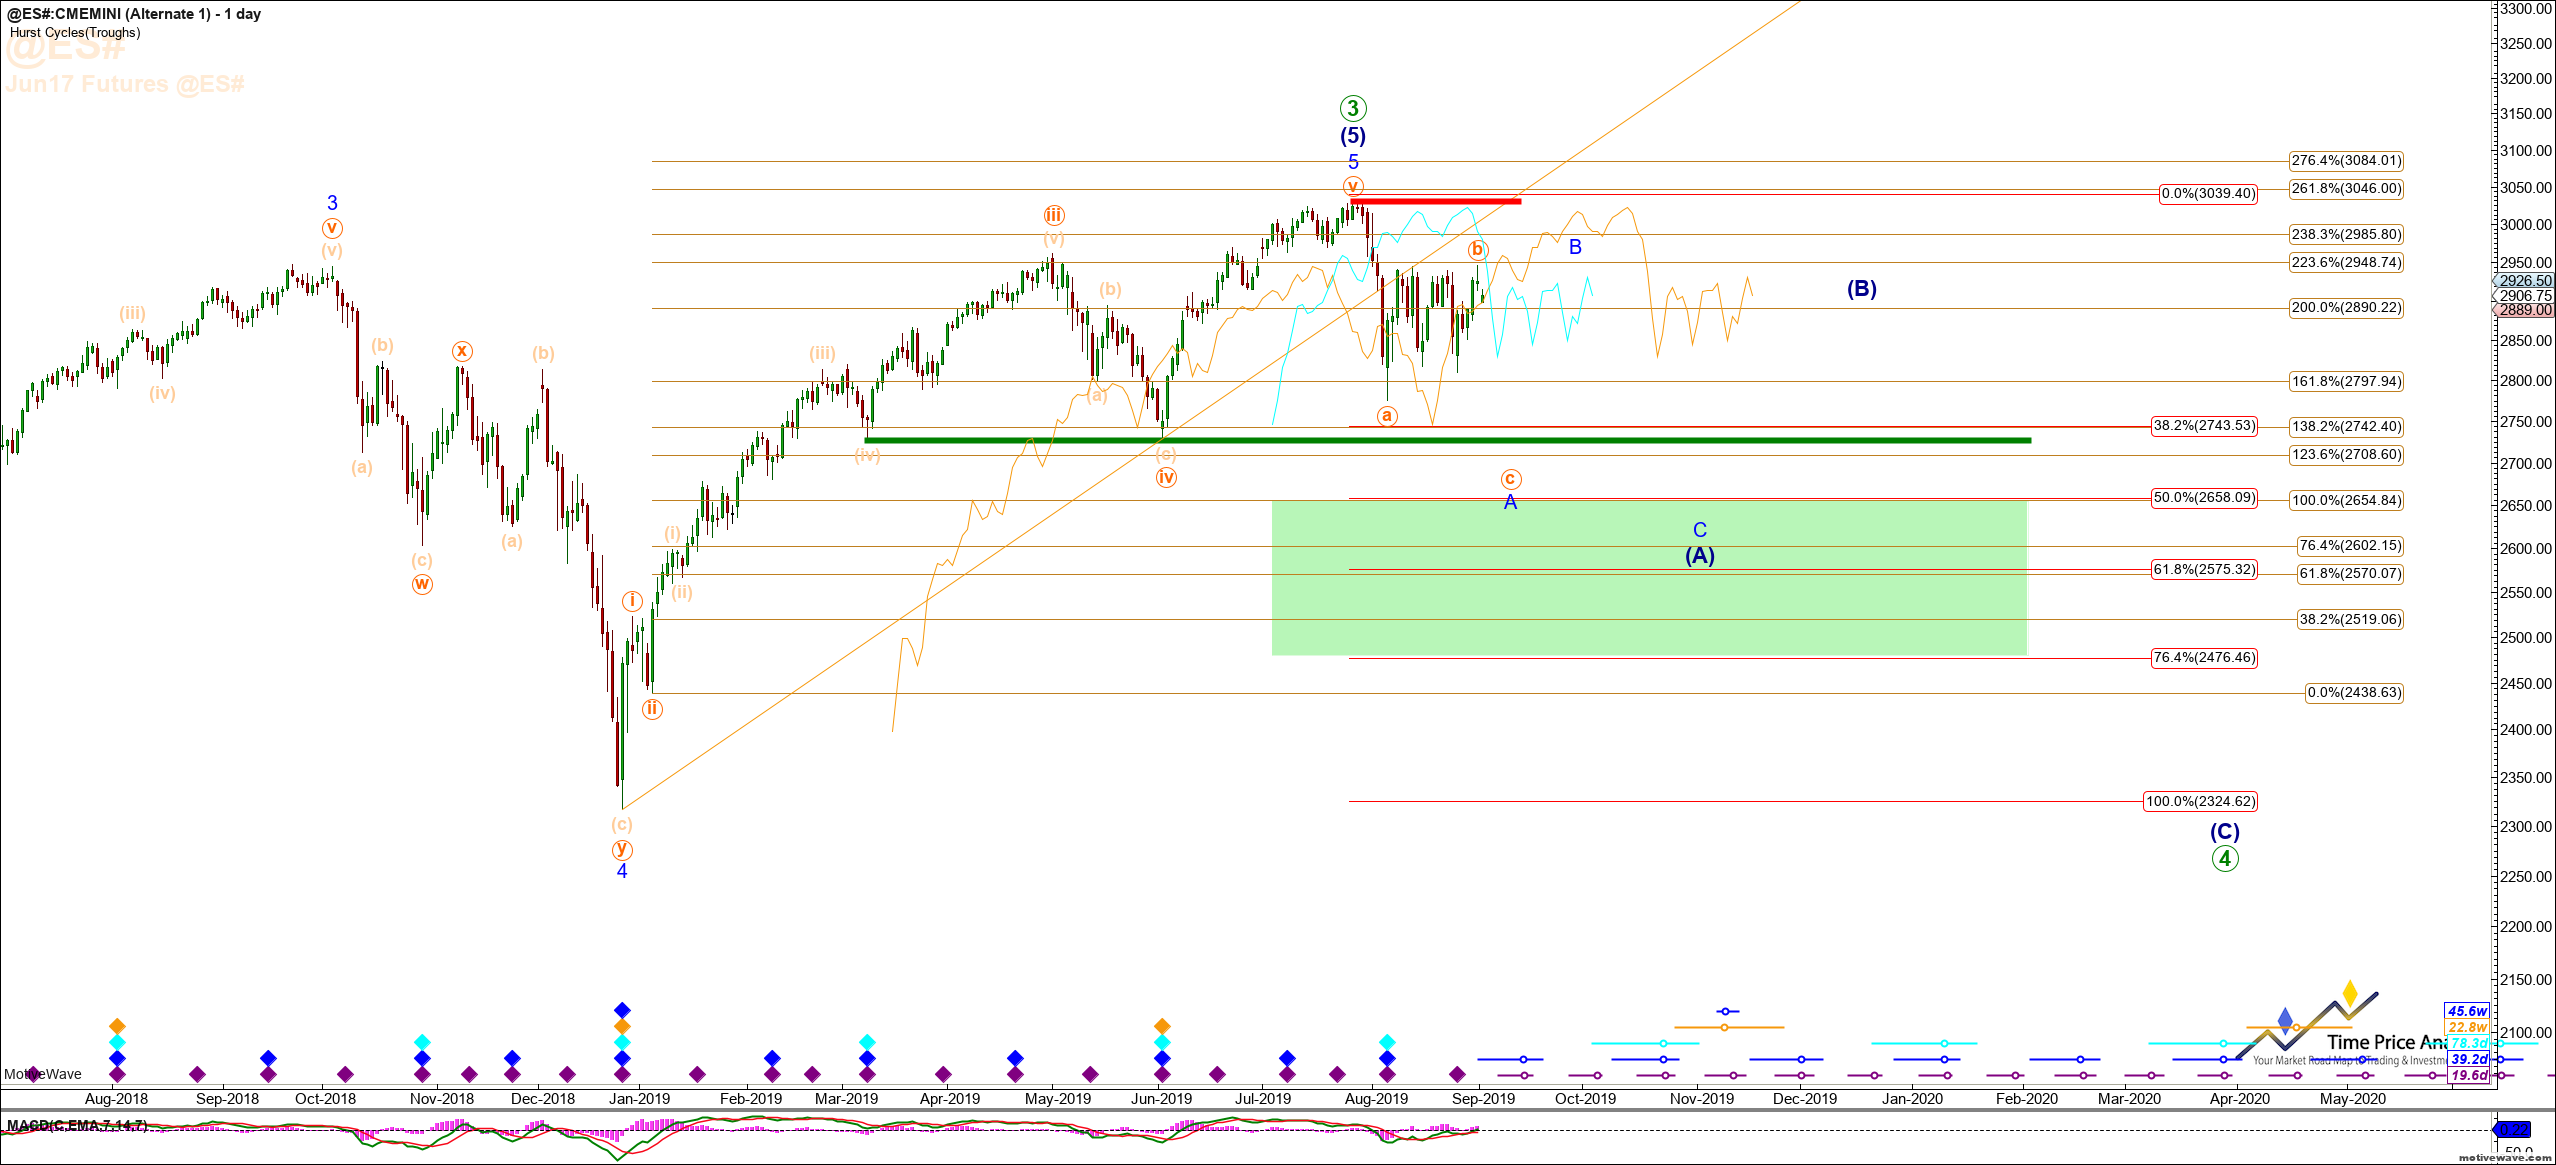
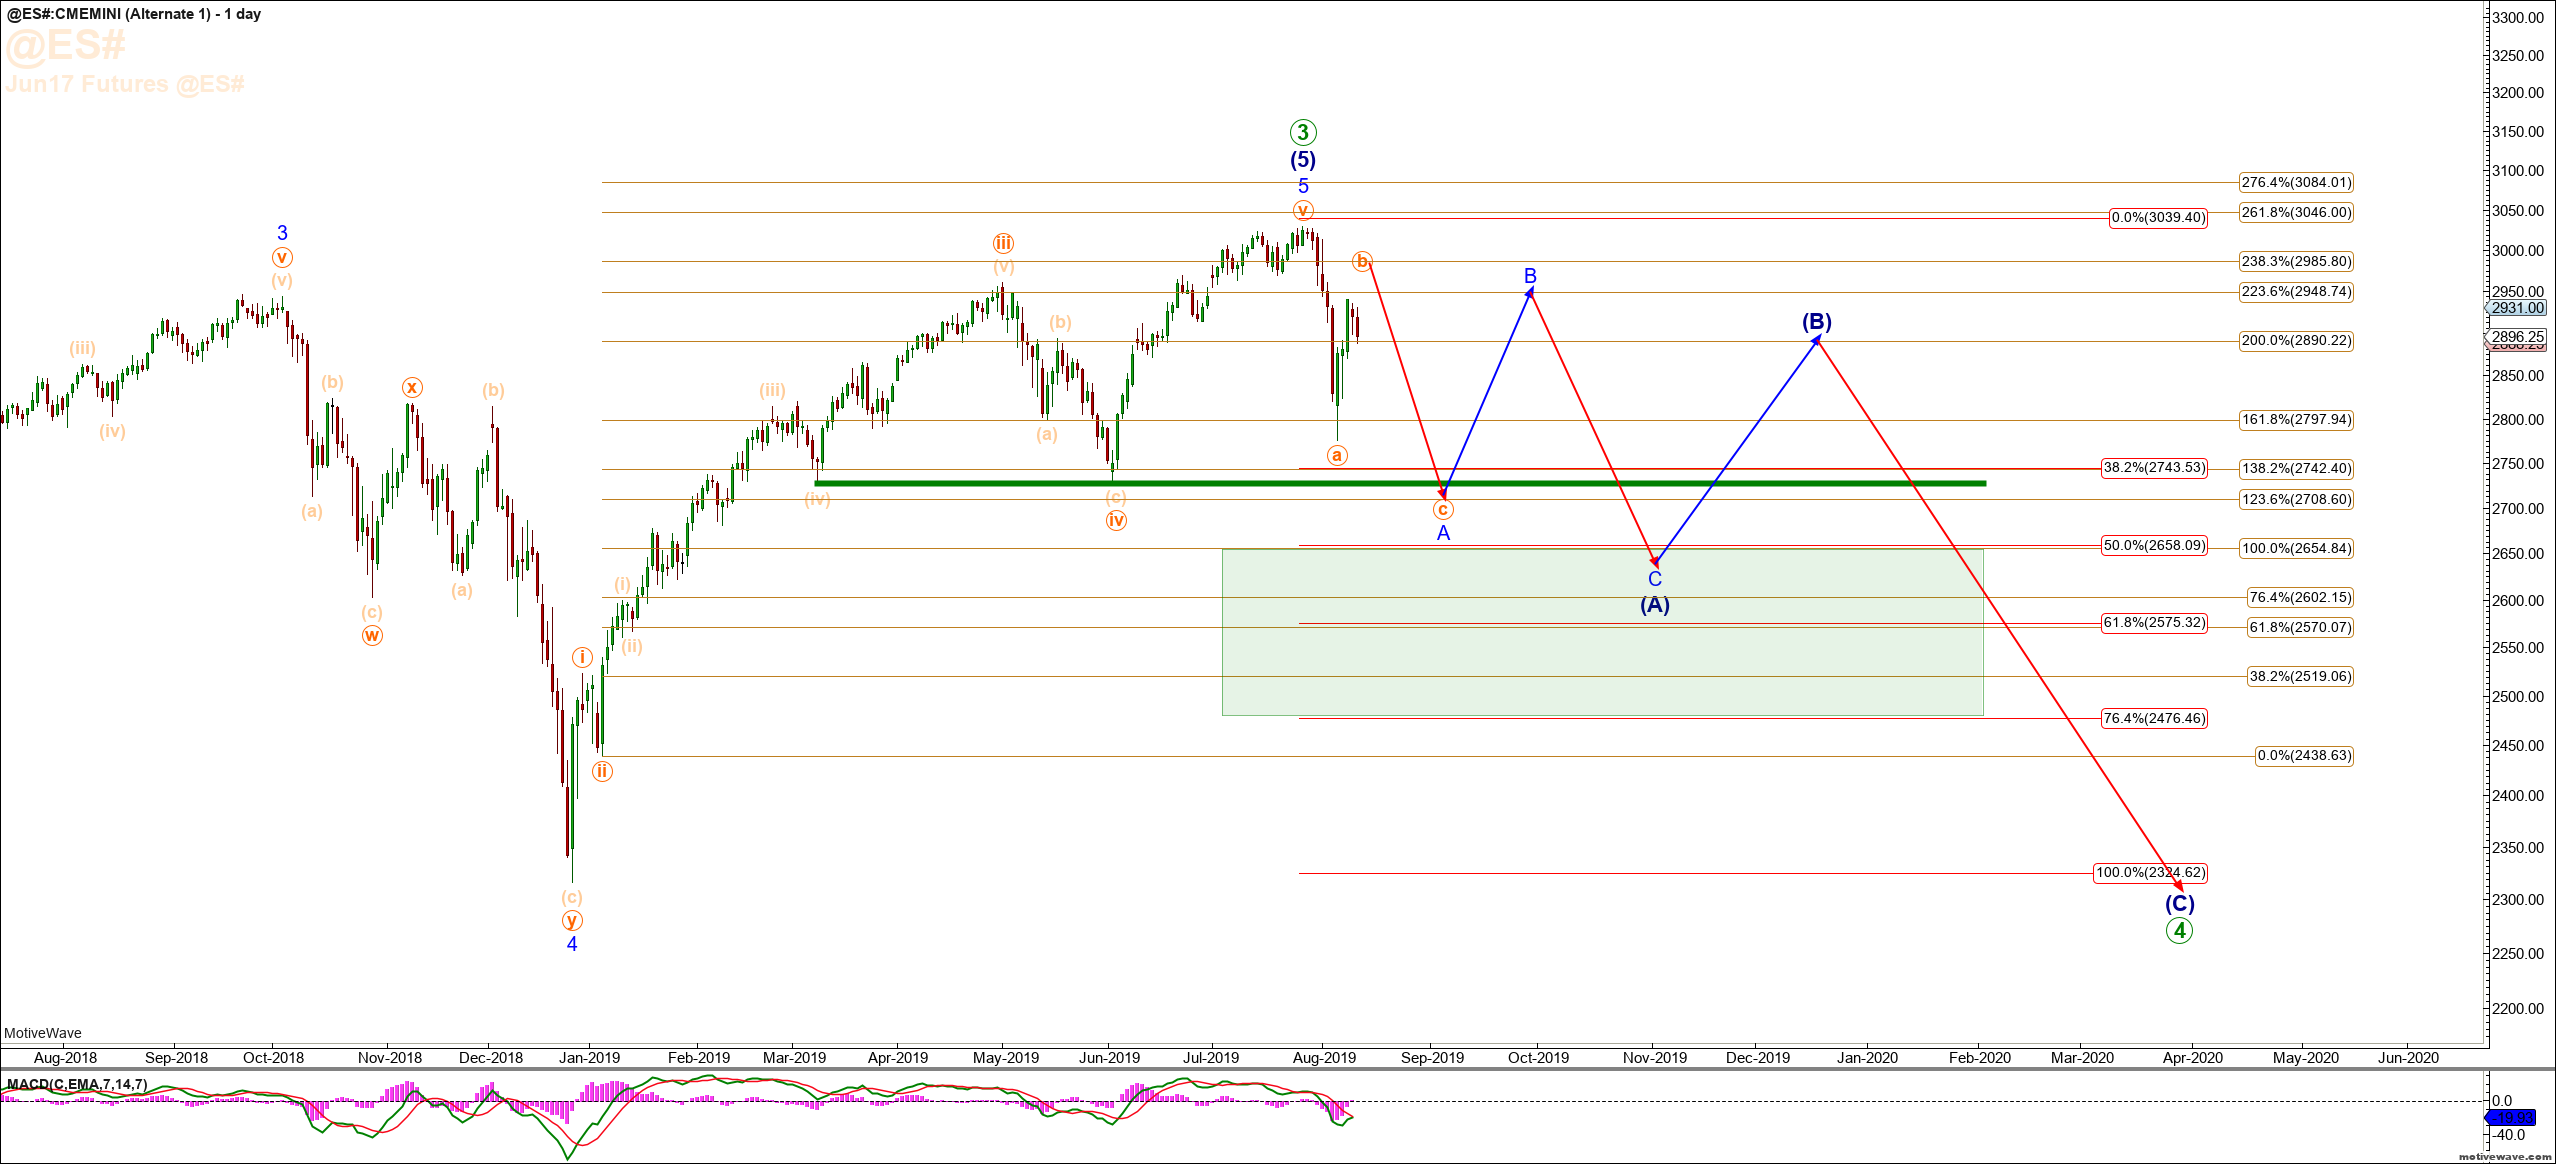 Now turn your attention to the S&P 500 Daily Emini Futures Contract Chart below. Our immediate expectation is that the initial A wave will conclude into 2740 - 2666 region or lower, to be followed by a large B wave bounce that will drop even lower into the late October to early November time frame. Next we expect a move up in an even larger (B) wave into early 2020 which will ultimately resolve once again in an even larger C wave drop into late spring to early summer 2020 into the SPX 2200-2300 region.
Once this correction concludes, it will provide an opportunity for investors to go long for the final 5th wave move up to the SPX 4,000 region. So, when considering buying the dip, recognize that this correction is a wave iv of Primary degree, and that the correction will likely be much more significant than most investors have either anticipated, or have the patience to await.
In conclusion, the wave iv correction is only just now getting underway. We expect the current (A) wave portion of the correction to conclude into late October to early November, and the provide a meaningful (B) wave bounce into early 2020, to be followed by the final capitulation style (C) wave drop into mid 2020. Investors who are trained by the robust market action in the last 8.5 years should be patient and look for the key areas to go long, and exercise significantly more discretion about their long exposure decisions. For active investors, this is a time to be in cash or have short exposure.