| Posted by Brian Fletcher on 15/09/2019 | 0 Comments |
The Elliott Wave patterns for crude oil continue to adhere in picture perfect fashion to provide investors multiple high-return opportunities.
Most investors believe crude oil will either go considerably higher or considerably lower. Over the next 12 months, they will all be right. But will they all make a profit?
This is a complex pattern for crude, and requires those who trade in the black gold to act swiftly when opportunities arise, but there are several phenomenal trades setting up.
Investing in crude oil long or inverse ETFs has offered active investors a host of exceptional opportunities this year, and for those who care to take the time to understand the Elliott Wave patterns in crude oil, it will soon be setting up some even more exceptional opportunities over the 12 months. I'm always amused by the polar opposite opinions from investors regarding price-level expectations for crude oil, and having charted the patterns for crude for many years I have grown to understand that it is one of the more emotional commodities that one can focus as a way of making substantial profits. When emotions are high, there is no better way to establish price-level expectations than by the use of Elliott Wave patterns and Fibonacci mathematics. Investors have strong opinions regarding price-level expectations: Some believe crude will go nowhere in price, others see it going substantially higher, and yet others believe price levels will go substantially lower. As you will see from our ongoing analysis, everyone will be right. The only question is: Will everyone make money on crude, or will many zig when crude oil zags? Regarding that latter possibility, I can tell you that we won't.
For some time now we have been suggesting that crude would head into our price target of $58.48 - $59.75 and reverse for a move to the $48 - $44 region. This week crude did exactly as expected, which allowed us to position our investors into shares of ProShares UltraPro 3x Short Crude Oil, where at the time of writing this article these positions are up 18%. Not shabby!
The Elliott Wave pattern for crude oil is extremely complex. It is a WXY inside a (B) wave that resides inside yet a larger B-wave. I shudder to write this, as even for those of us proficient in charting Elliott Wave patterns, this type of structure is not only difficult to identify and chart, but is notable in its very consistent 3-wave moves and its lack of impulsive structures. It requires patience and steadfast resolve in order to invest and trade. This being said, in the not-so-distant future the overall pattern in crude oil is going to become an Elliottician's dream, and therefore an investor's dream: It will be setting up three very large C-wave structures in a row that occur over a period of multiple months. For those on the correct side of these machinations, who are willing to take the time to understand how to take advantage, the spoils will indeed be significant. From an Elliott Wave perspective, a C-wave is not only a reasonably fast and furious wave structure from a timing standpoint, but C-wave are always a 5 wave move, or what Elliott terms "impulsive" in their nature. Impulsive moves are very chart-friendly wave structures that adhere nicely to Fibonacci levels, and allow us to forecast price levels with much very good levels of accuracy.
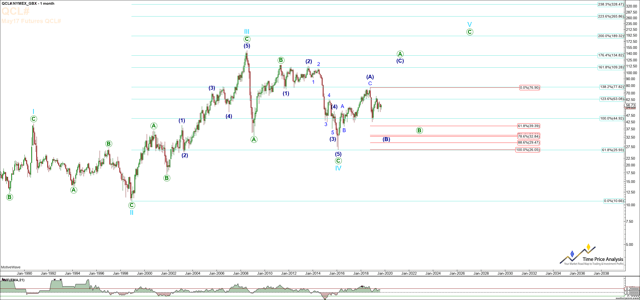
To better understand how all this relates to making real profits, let us first take a bird's eye view of the very complex larger degree pattern that is occurring in crude - see Crude Oil Monthly Chart below.
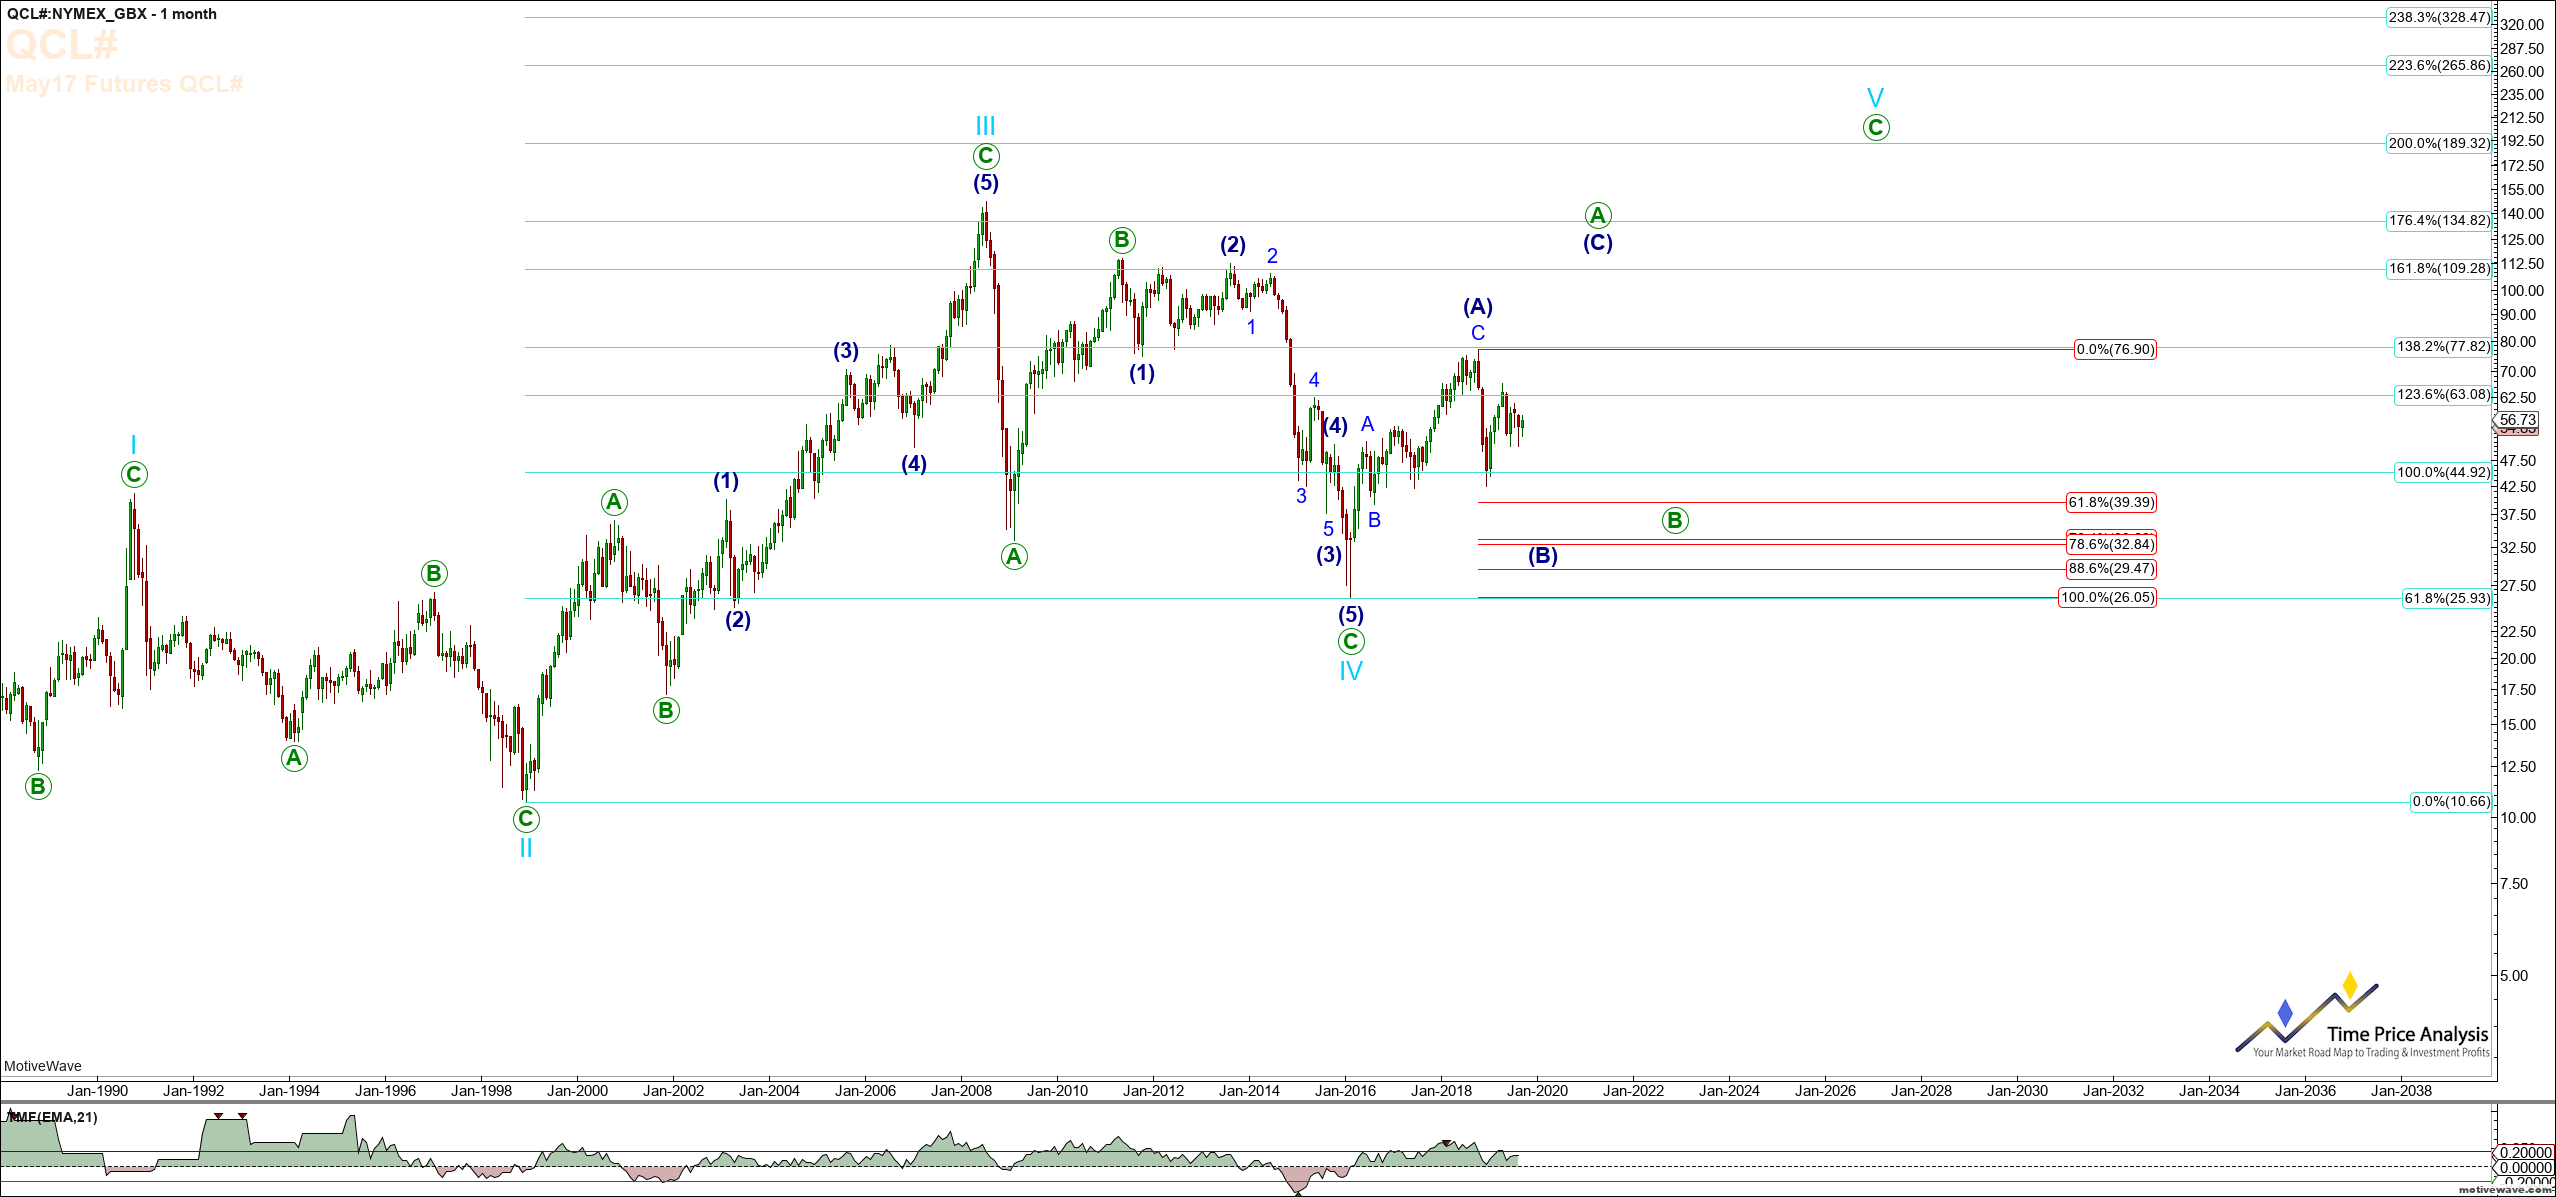
Note that from a long term perspective, crude is forming a very large diagonal to the upside. Diagonal waves consist of 3 waves versus 5 waves, and are a combination of ABCs. Note that crude is now in the blue (B) wave portion of the larger diagonal that eventually targets the $190 region. However, this is many years into the future. Presently it is making its way down to the low $30s region. However, don't just go short crude for a move to $30, as the pattern by which it will get to these levels over the next 12 months will afford several trade opportunities, and one of those will be a rather large crude oil long opportunity.
Now, how does crude ultimately arrive into the $32 region before the big move up? Turn your attention now to the Crude Oil Daily Chart below. The high seen this week represents our long expected x-wave into the $58.50 - $59.75 region, and in picture perfect fashion crude oil hit the .786 Fibonacci level, and reversed sharply. It never ceases to amaze me how a bit of news always seems to arrive "Johnny on the Spot" into our target region that those who don't follow Elliott Wave analysis attribute to some macro fundamental tidbit of news. This time it happened to be President Trump's announcement via Twitter asking for and accepting John Bolton's resignation. The media quickly concludes that this must mean crude will drop since sanctions against major oil producers like Iran or Venezuela will be loosened, thus increasing global supply of crude oil. For what it is worth, it wasn't until writing this article that I even bothered with researching the reasons as to why the media is suggesting a drop in crude. It hit our Fibonacci levels, we took a position with a very tight risk-relative-to-reward stop-out level established, and like every trade we take in crude, we sat back to see what would later be attributable to causing a reaction. I seriously doubt Mr. Trump considered crude was at its .786 Fibonacci retrace level when he decided to tweet.
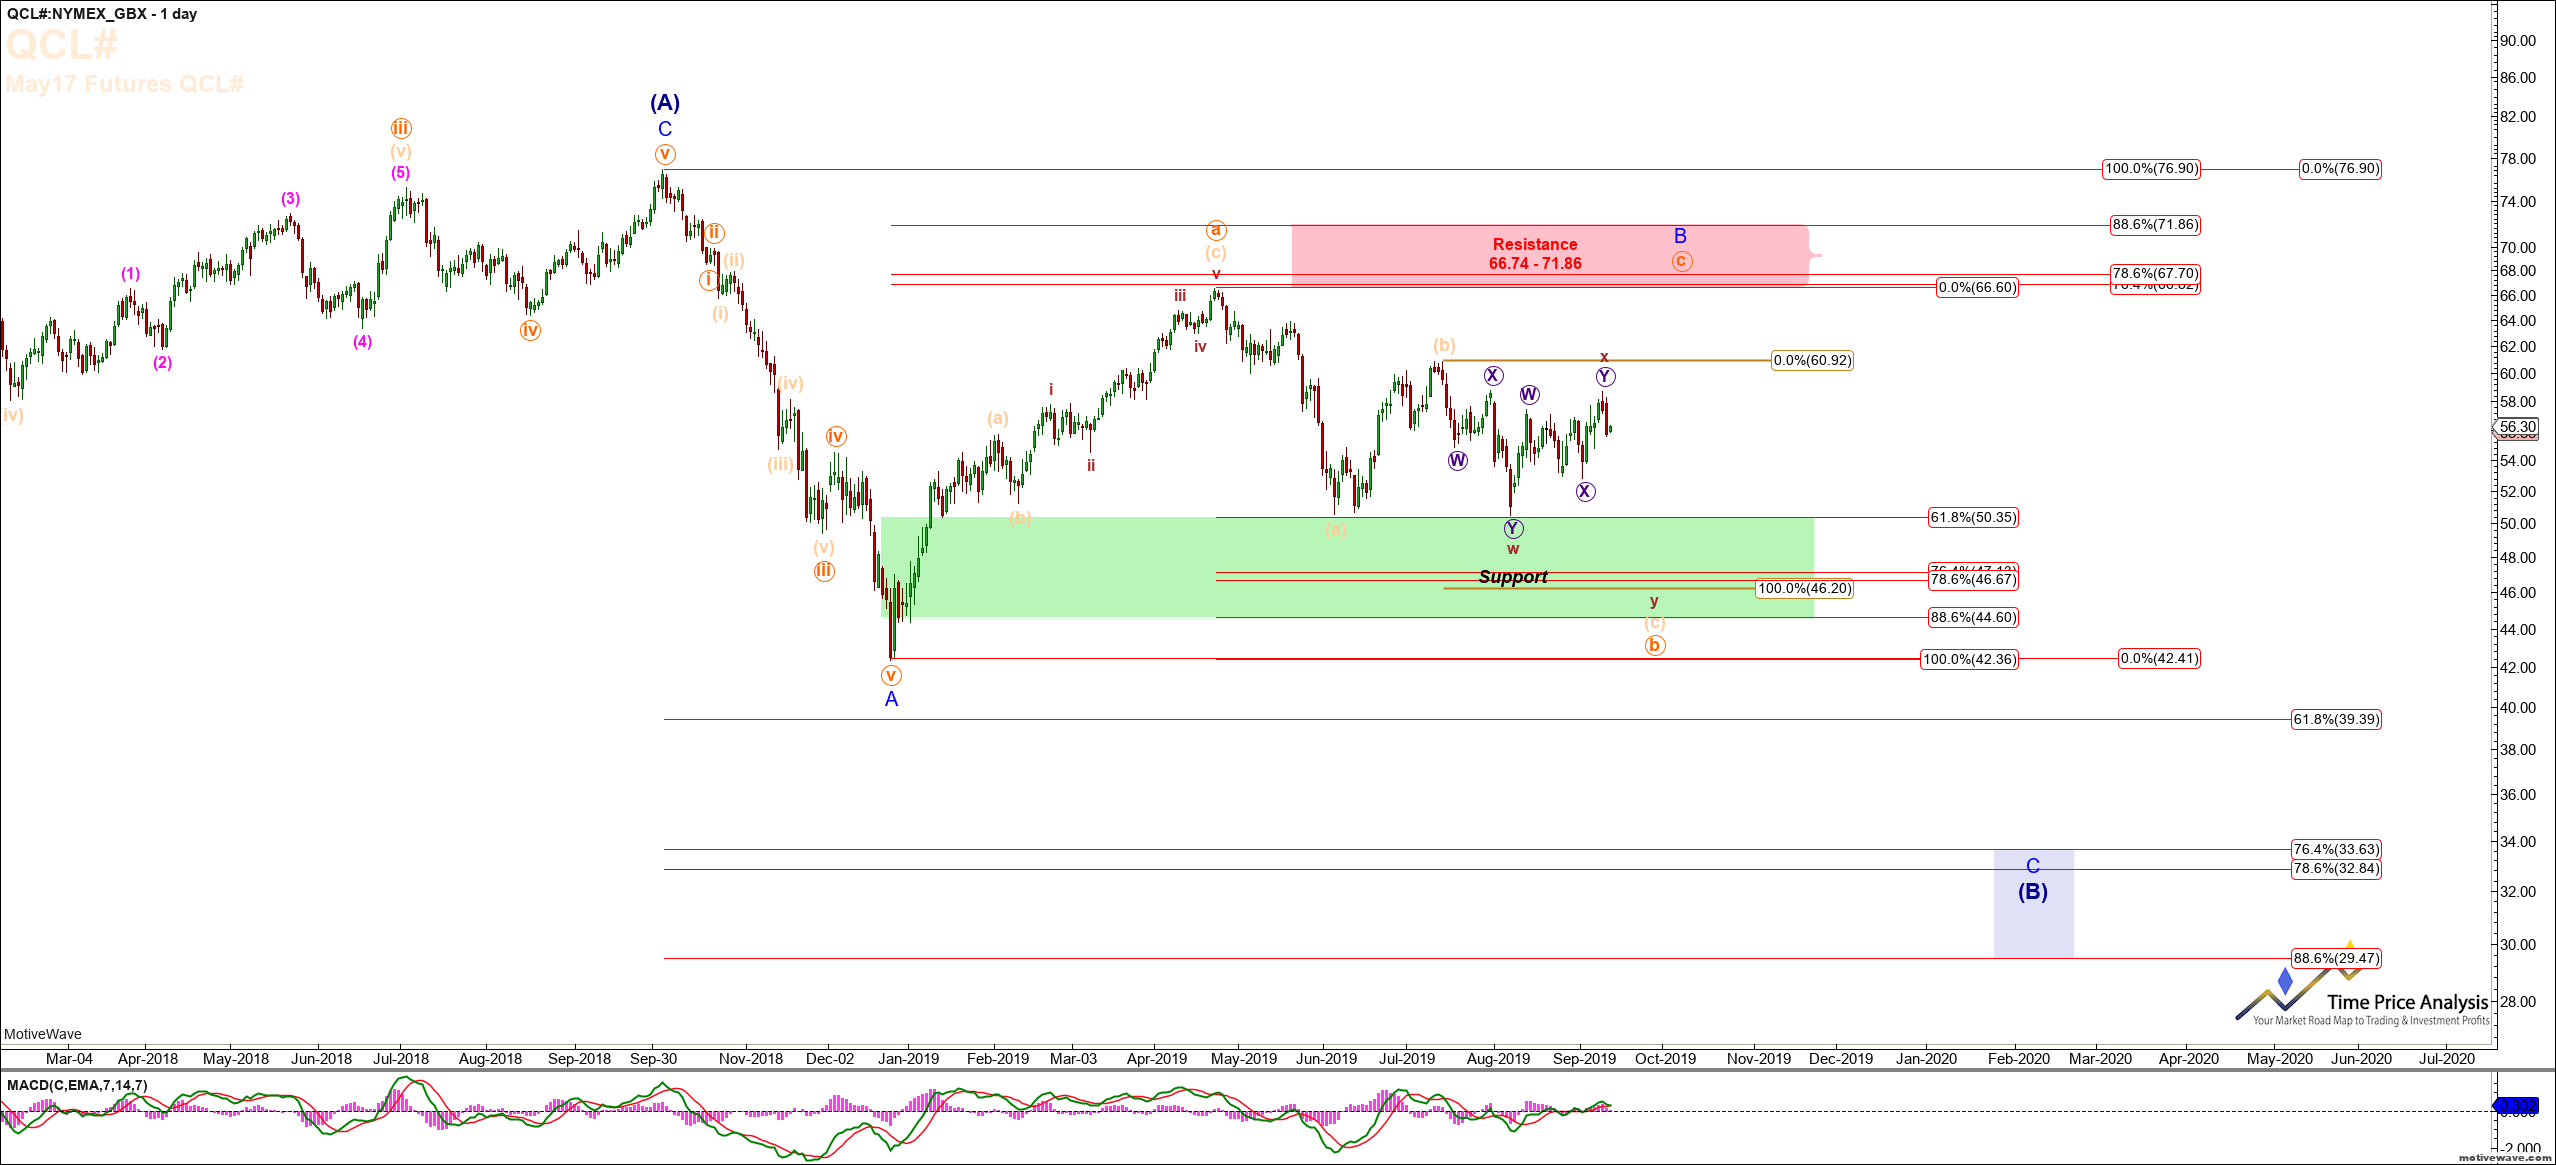
Note on the Crude Oil Daily chart that we are expecting a move down to the Fibonacci .786 - .886 retrace of the move up that occurred from late December 2018. This move down would represent a b-wave in a much larger B wave that ultimately resolves its way up to the $67 - $72 region before a much larger move down to $32 occurs. It is this next move up from the $48 - $44 region that will be the first in a series of 3 large C-waves. Once this move up completes, we will then expect a 2nd C-wave to resolve with a move down to the $32 level, which will be investors last chance to climb aboard a multiyear move in crude to a price level in excess of $100 per bbl.
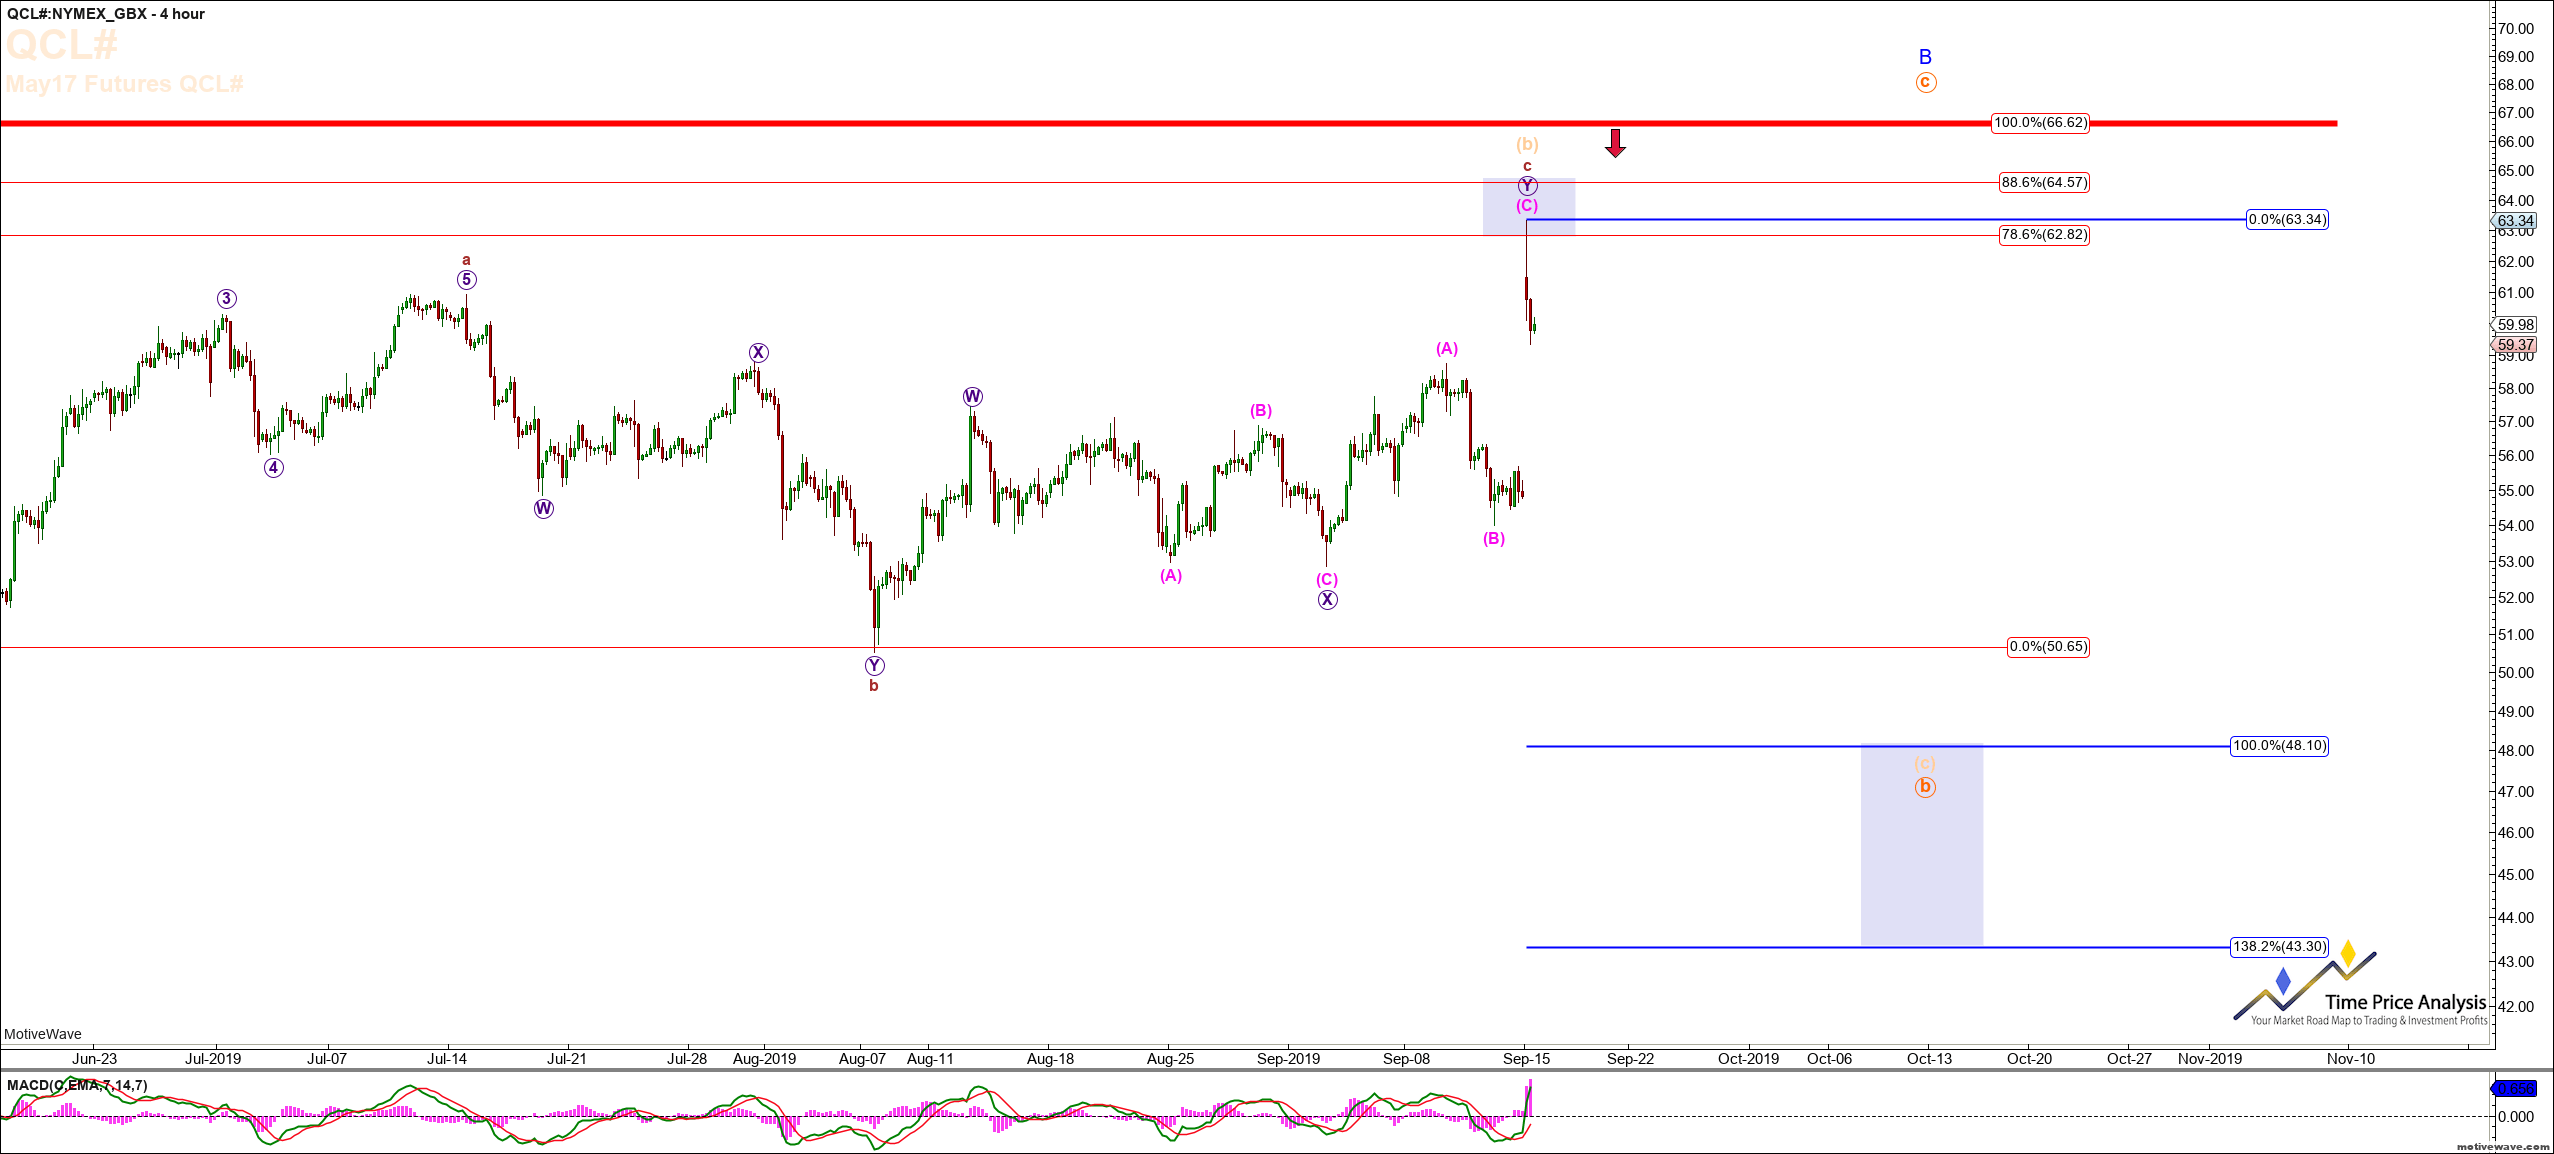
Lastly, turn your attention to the Crude Oil 60-Minute Chart below. Note that crude hit the .786 retrace level virtually to the penny and reacted sharply downward. It was the reaction at this Fib level that spawned us into a ProShares UltraPro 3x Short Crude Oil ETF (NYSEARCA:OILD) position for investors. On a smaller time frame, we are now looking for crude to complete an initial impulsive move off the $58.74 high to complete what will either be a wave i, or an a-wave in a wxy pattern. It is semantics at this point as to whether one counts the next move down as a larger impulsive c-wave, or an abc in a Y-wave, as shown on the Daily Chart. Both have the exact same target representing a move down to $48 - $44.

So in conclusion, crude offers some exemplary investment opportunities for those willing to take the time to follow along with this analysis. There is no question the pattern is complex, and like most B waves it may morph into other smaller-time-frame patterns. As it does, we will remain objective at all times in our expectations, and adjust to changes as they occur. As of right now, we have locked in half our profits, have stop-out orders on the remaining half, and are content to allow the pattern in crude oil to play out by monitoring levels where it can reverse in order to exit our position.
Long-term, our expectations are for a move down to the low $30 region, by way of a rather large rally up to the high $60s first, and even longer term we expect to see crude well over $100.
Note, the gap up in crude has not fundamentally changed our larger picture counts on crude, and we are still expecting a move down to the 48-46 region.
Update, September 16, 2019, 10:10 a.m.: We exited all shorts in crude near last week's low, between the time we submitted this article and the time it was published.