| Posted by Brian Fletcher on 01/10/2019 | 0 Comments |

Until the S&P 500 is able to take out the high established in late July, we are still looking to lower levels.
Corrective action is difficult, and 4th waves are the most difficult and variable patterns for investors to trade.
Our expectations for price levels and timing continue in this series relating to the forthcoming correction. It won't happen overnight, and will take some time to unfold in it's entirety.
On July 31, 2019 Seeking Alpha published the first in a series of articles I’ve written regarding a forthcoming correction in the S&P 500. At the time I wrote this article, the S&P 500 was in the 3020 region. Since this date the S&P has traded down 2823, and bounced back to a virtual double top.
It is important to understand that while this analysis may or may not be exactly accurate, the Elliott Wave pattern into the July high is consistent with a Primary degree wave (3), and the market action since this high has been consistent with the beginning stages of a Primary degree wave (4). So, unless and until the S&P 500 is able to take out the July 26 high, this will remain our primary expectation. From a Hurst cycles perspective, we expect a move down into mid- to late October regardless of whether the S&P 500 can make another high.
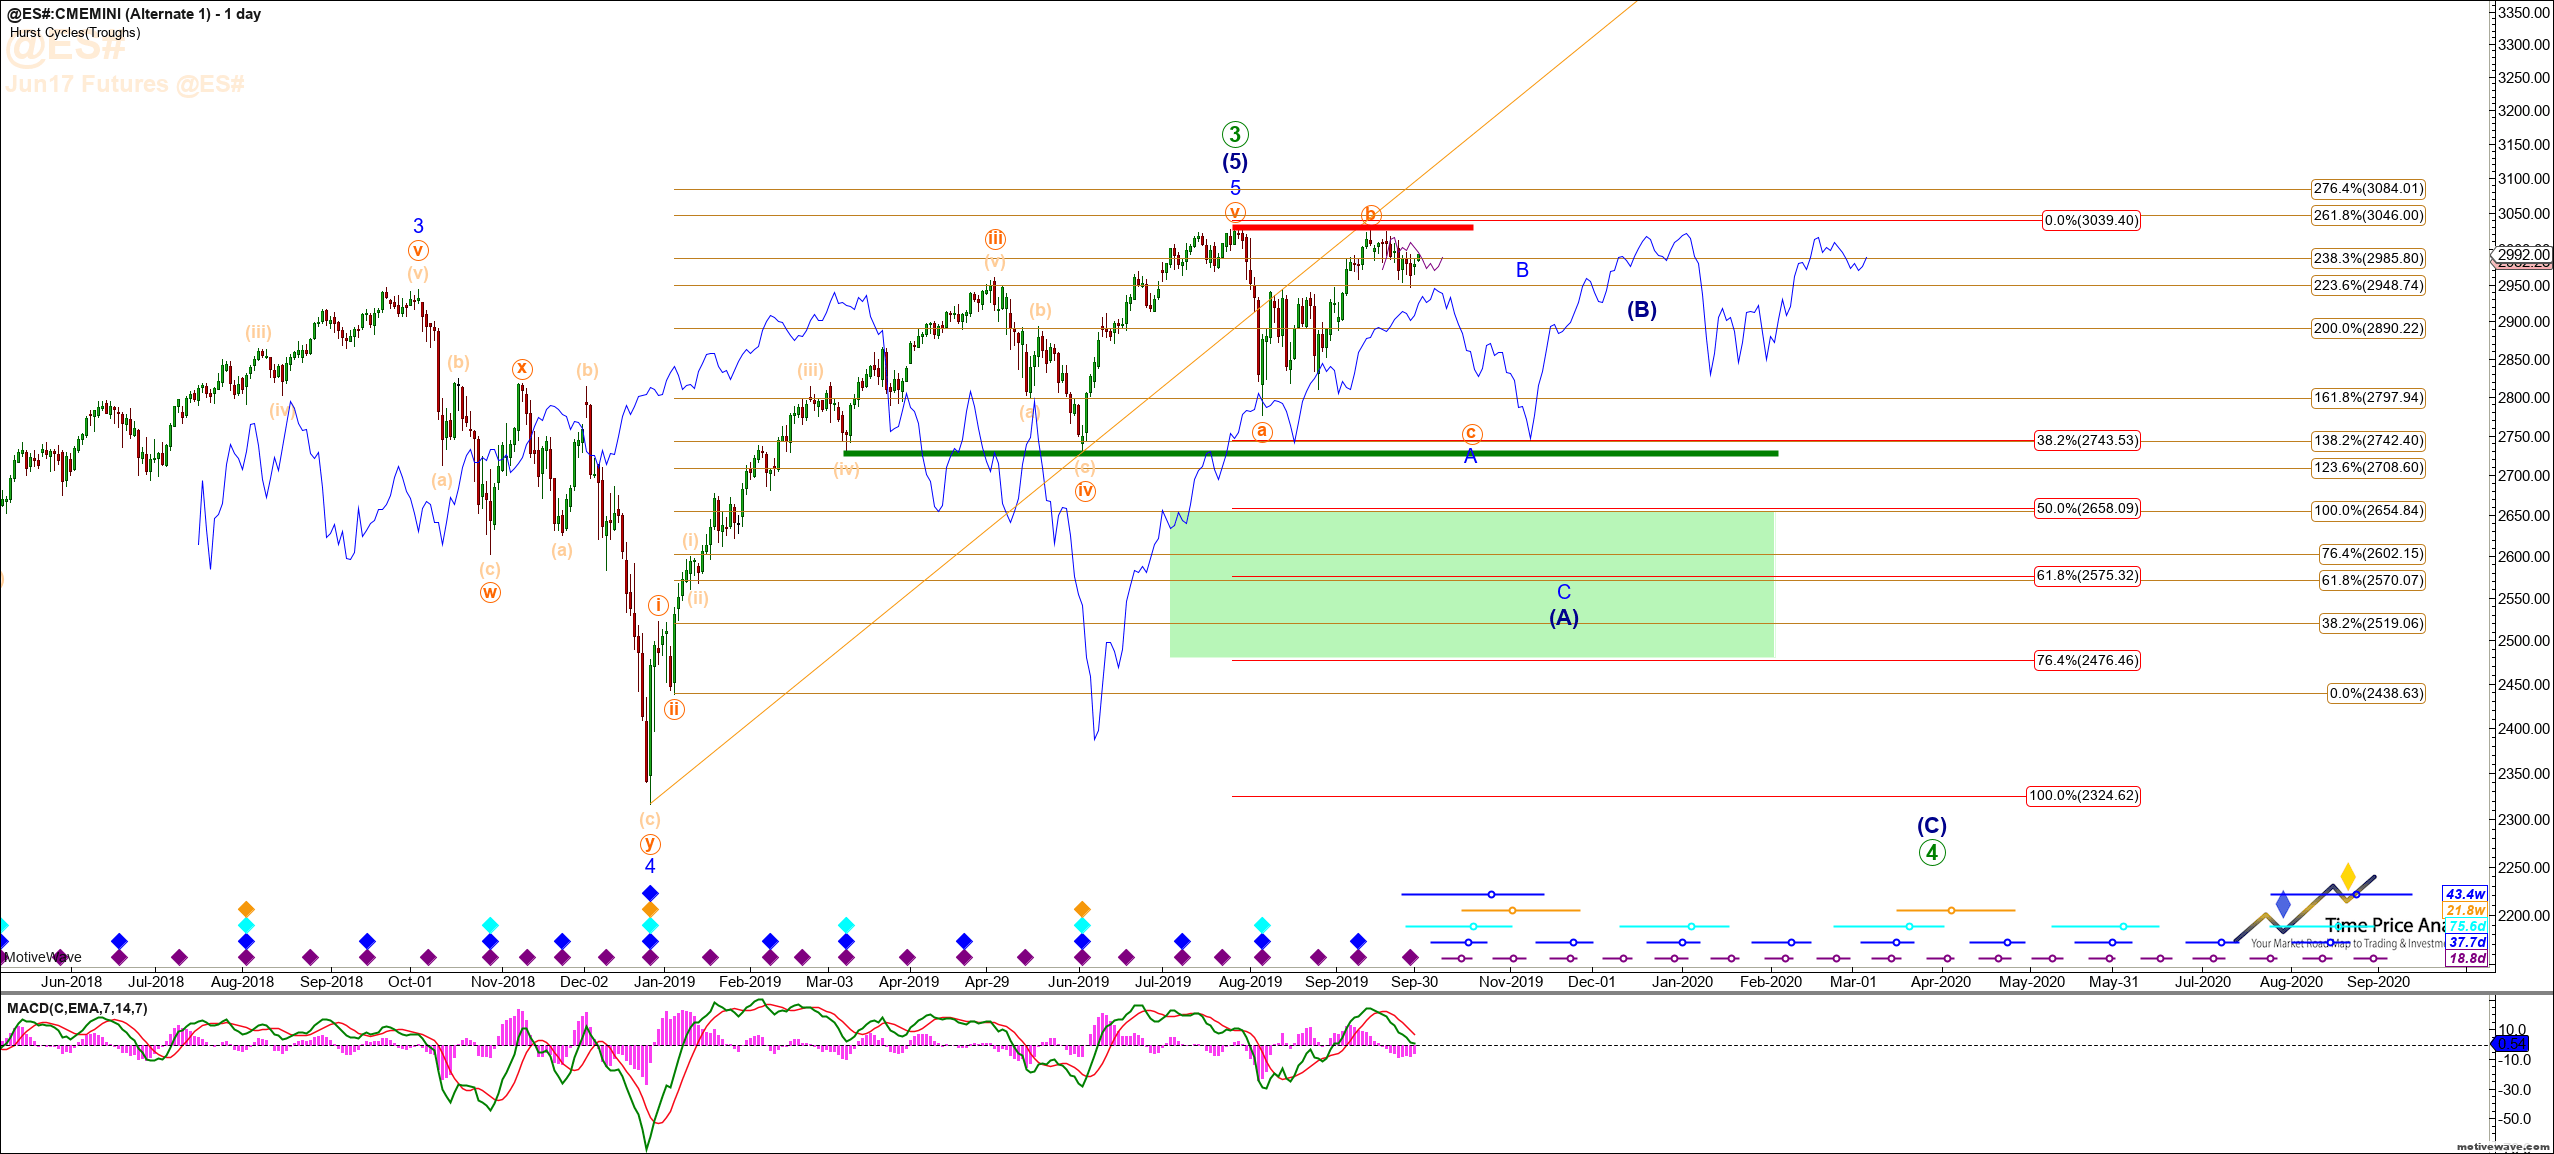
In this article I will provide our immediate expectations for price movement in the S&P 500 into mid to late October. Again, let’s review the S&P 500 Daily Emini Futures Contract chart below.
Note that we are viewing the December 2018 low as the intermediate degree wave 4, in blue. Since then, the S&P 500 has rallied in an impulsive fashion into an overall 1.764 extension of the move off the 2009 low – not shown on this chart. While we expect a move down into mid to late October as the (A) wave of primary degree wave 4, shown as the green circle 4 on this chart, it can also represent a retrace against the entire move up off the late 2018 low, resulting in a rally that would then take out the all-time highs on its way to much higher levels. It is for this reason that we will consider long positions in this region.
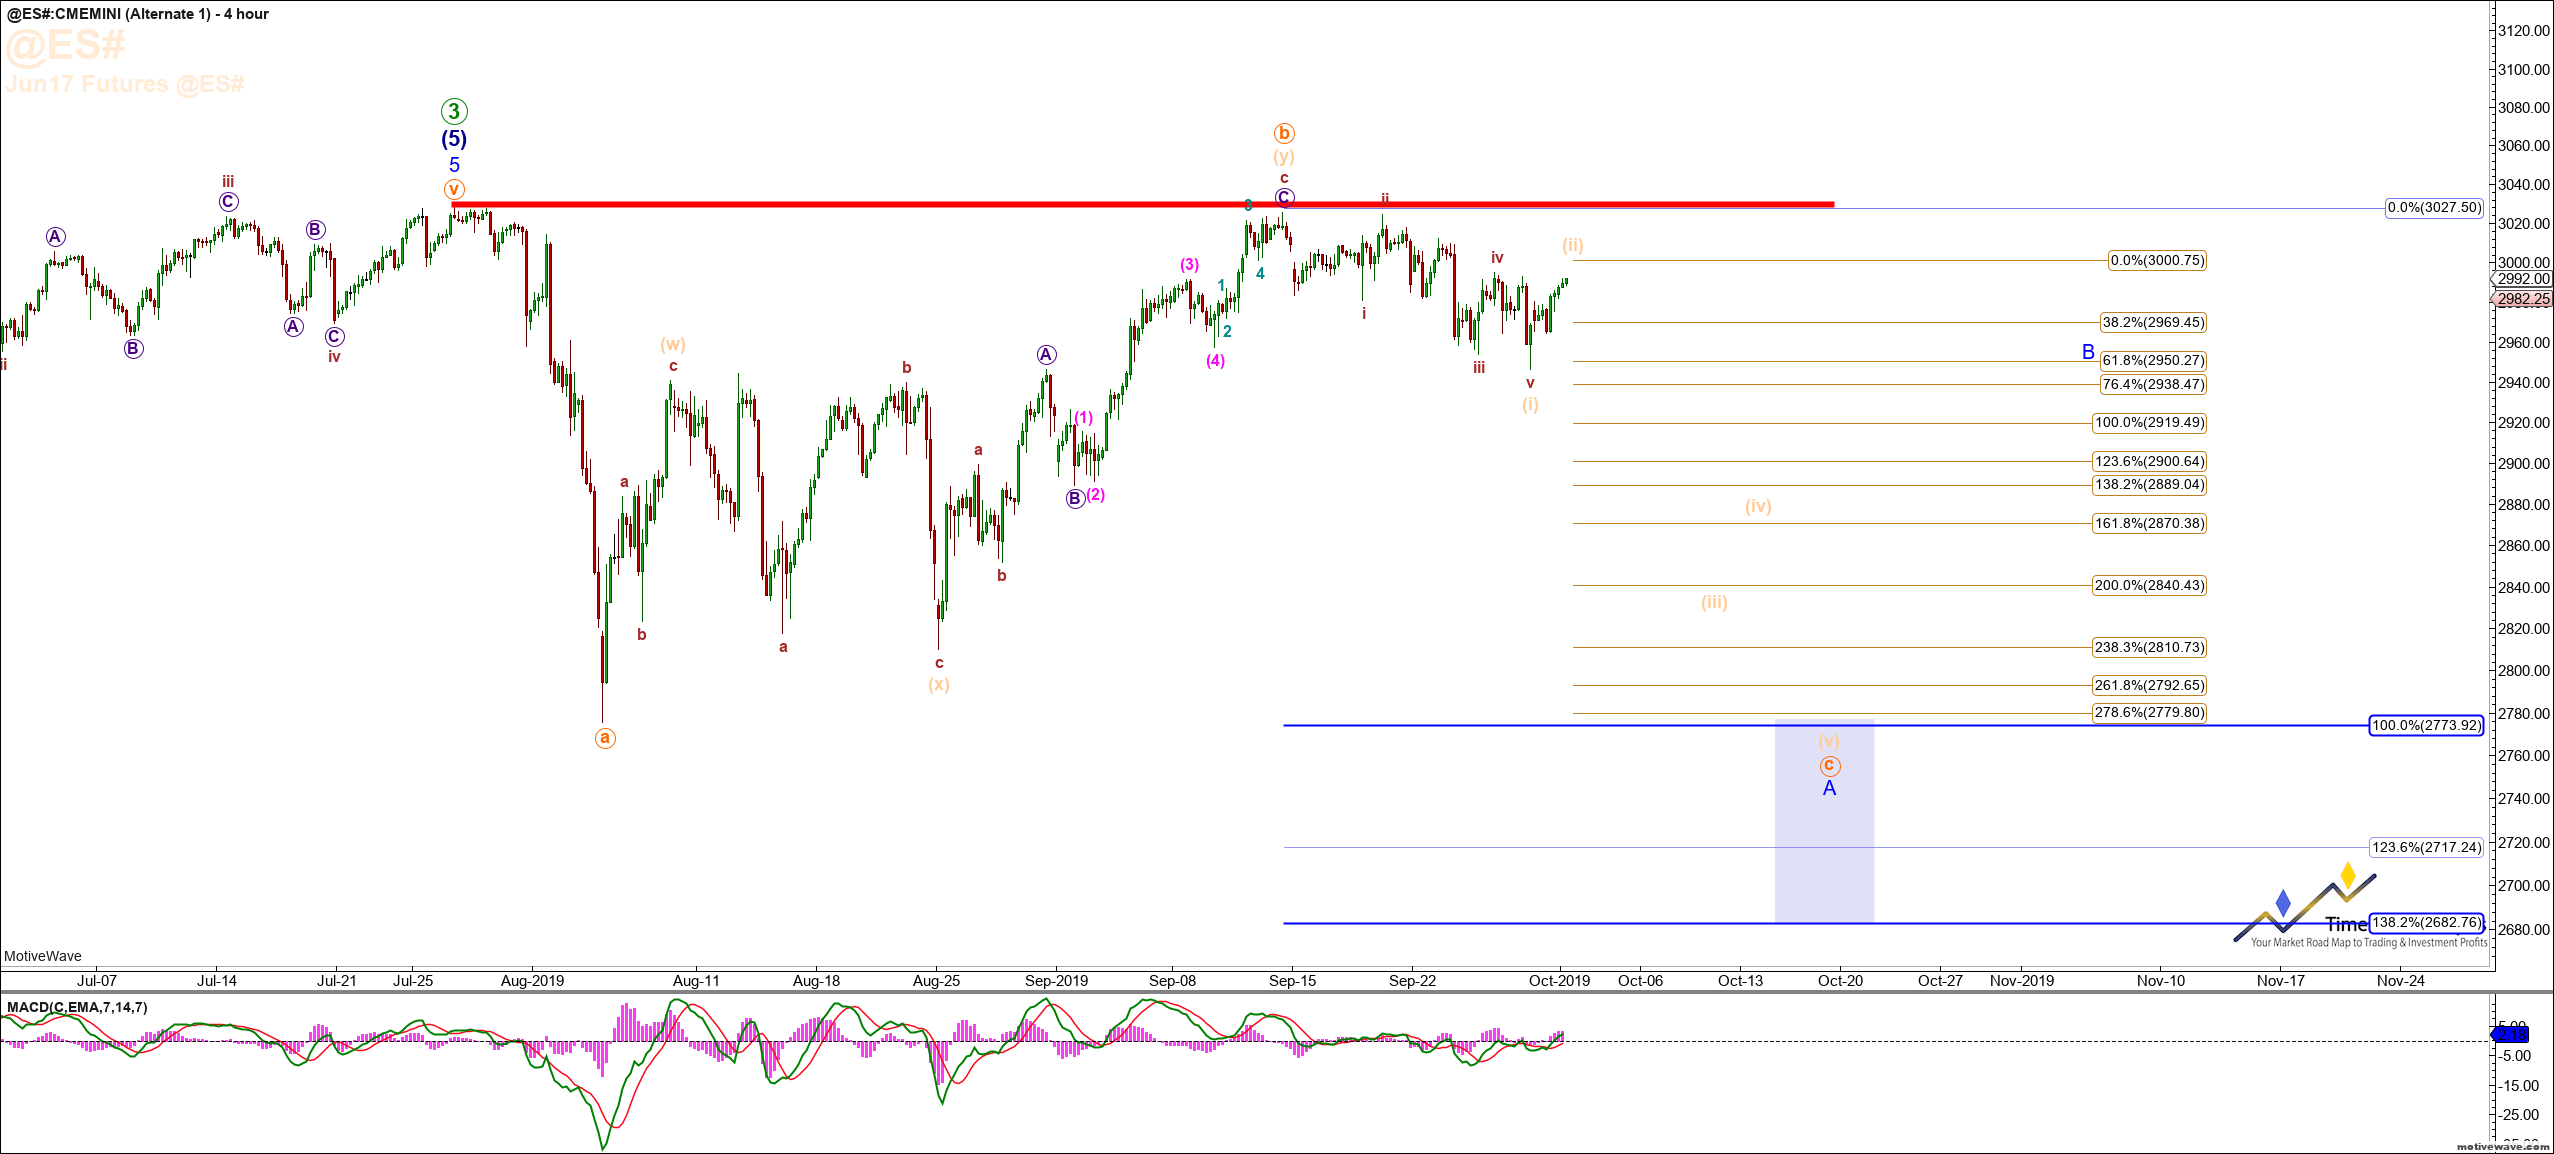
 Now let’s turn our attention to the S&P 500 5 Hour Emini Futures Contract Chart below. We are viewing the initial move down into the Aug. 6 low as an initial (A) wave, and the overlapping move back to near the prior high as a (B) wave. What comes next is a (C) wave of the A wave of Primary Degree wave 4. The initial wave structure of the (C) wave best counts as a leading diagonal, and therefore as long as the S&P Emini now stays below 3026 at all times, we would expect it to continue down to a price target of 2773 – 2682 into mid to late October.
 In conclusion, as long as the S&P 500 stays below its all-time high established in late July, we still expect a substantial move lower. 4th waves are the most variable and difficult wave patterns in any instrument or index, and much like a bull market climbs a wall of worry, corrective patterns persist on being difficult to catch major moves. The will consolidate, provide rounding tops, and v-shaped recoveries only to open trap doors to lower levels that are swift and abrupt, and tend to leave most short traders behind. They force market participates to constantly question if the next breakout is getting ready to occur, only to come short of delivering on expected breakouts and provide heart wrenching downside moves instead. Until such time as the all-time high would invalidate the immediate expectation for lower, we will continue with this series relating to the overall forthcoming correction.